Your Chief Development Agent for Smarter Growth
SiteZeus is the leader in AI-powered Site Selection software for franchise and multi-unit brands. Combining sophisticated data and AI-powered predictions to enable faster, more confident expansion decisions.
Trusted by leading brands


Make smarter decisions with
AI at your fingertips
Accelerate your expansion with an intelligent, context-aware AI assistant that analyzes markets, forecasts revenue, and recommends optimal sites for you at scale.
The full stack for multi-unit growth
Zeus.ai is the intelligent layer that sits on top of our entire product stack, while the Olympus Data Exchange fuels every product with enriched data.
Locate
Site selection software
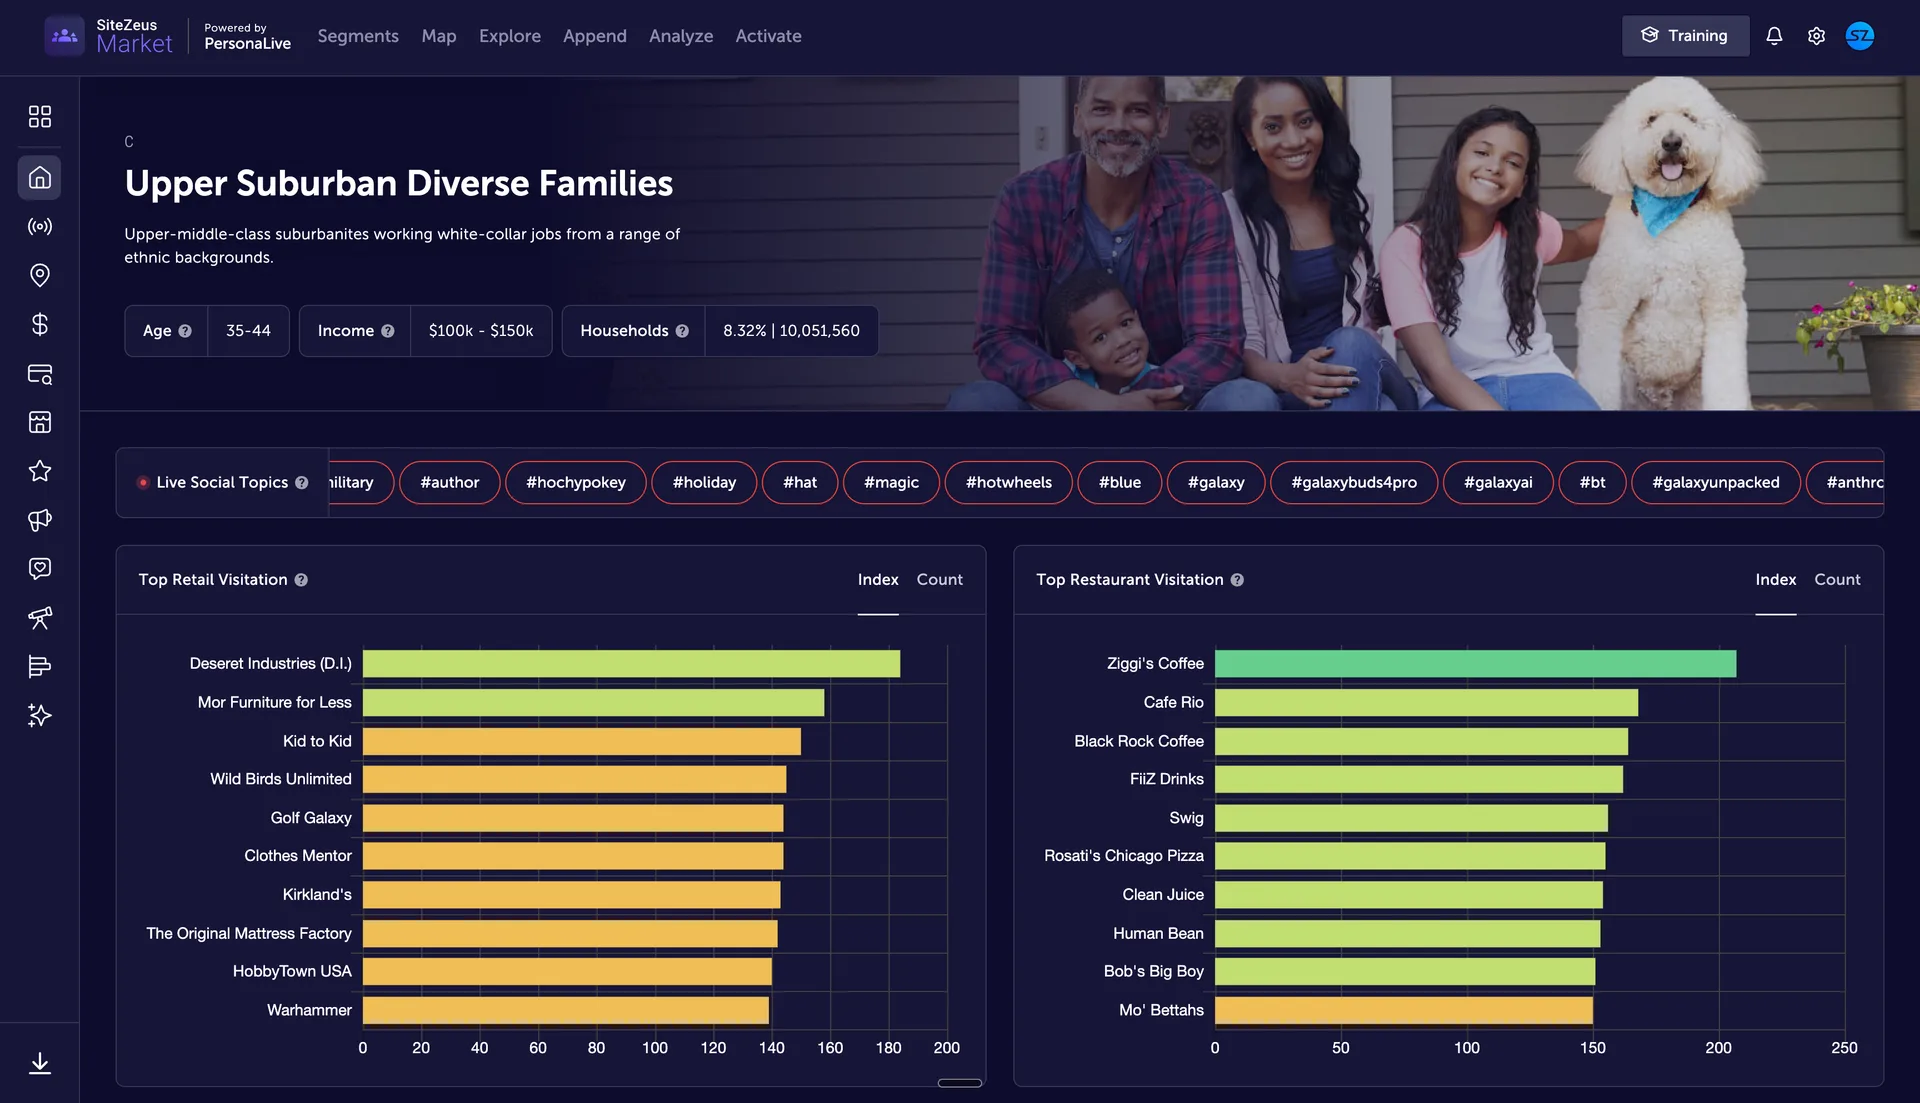
Customer Insights
Consumer intelligence platform
Build
Construction management software
Sell
Franchise CRM
The data foundation fueling every product with deeper insights
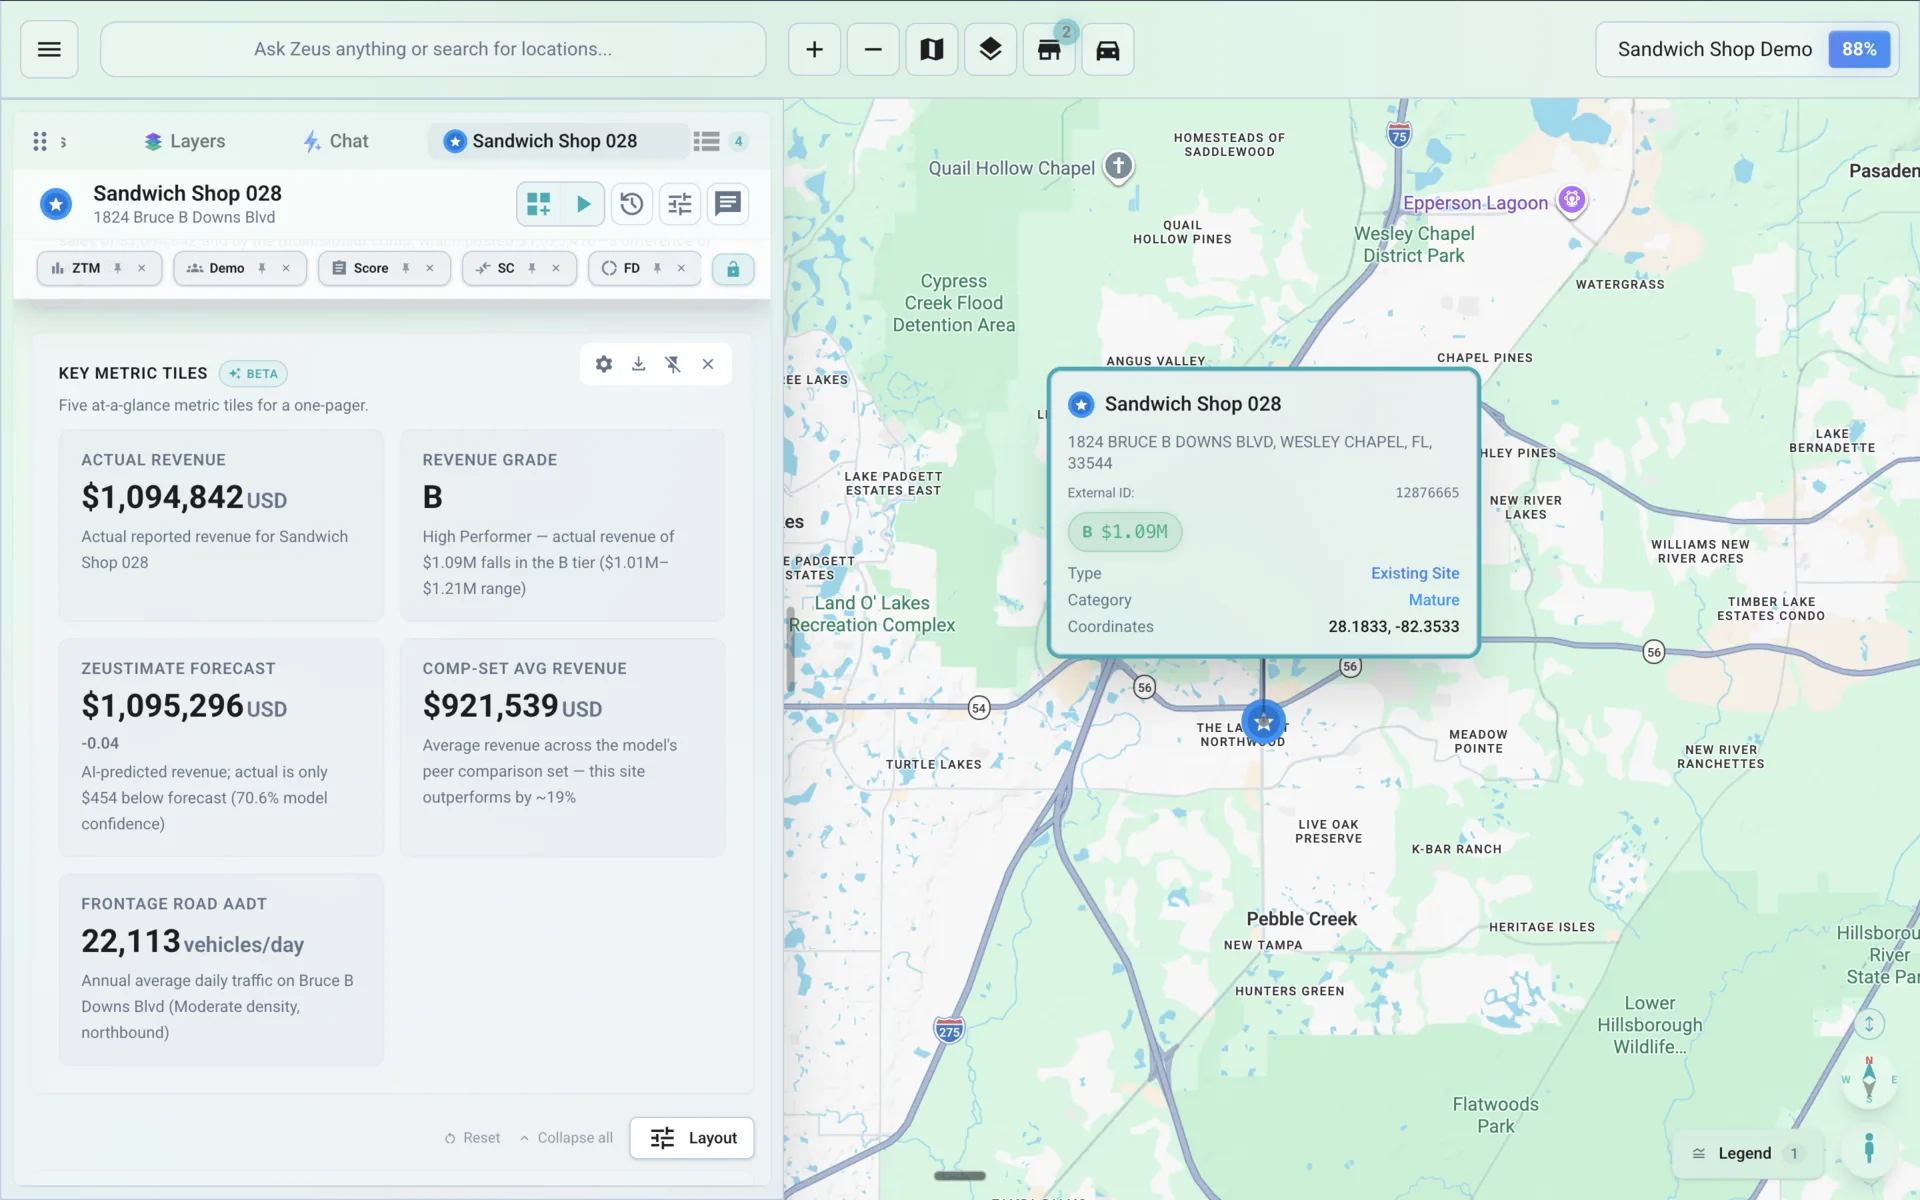
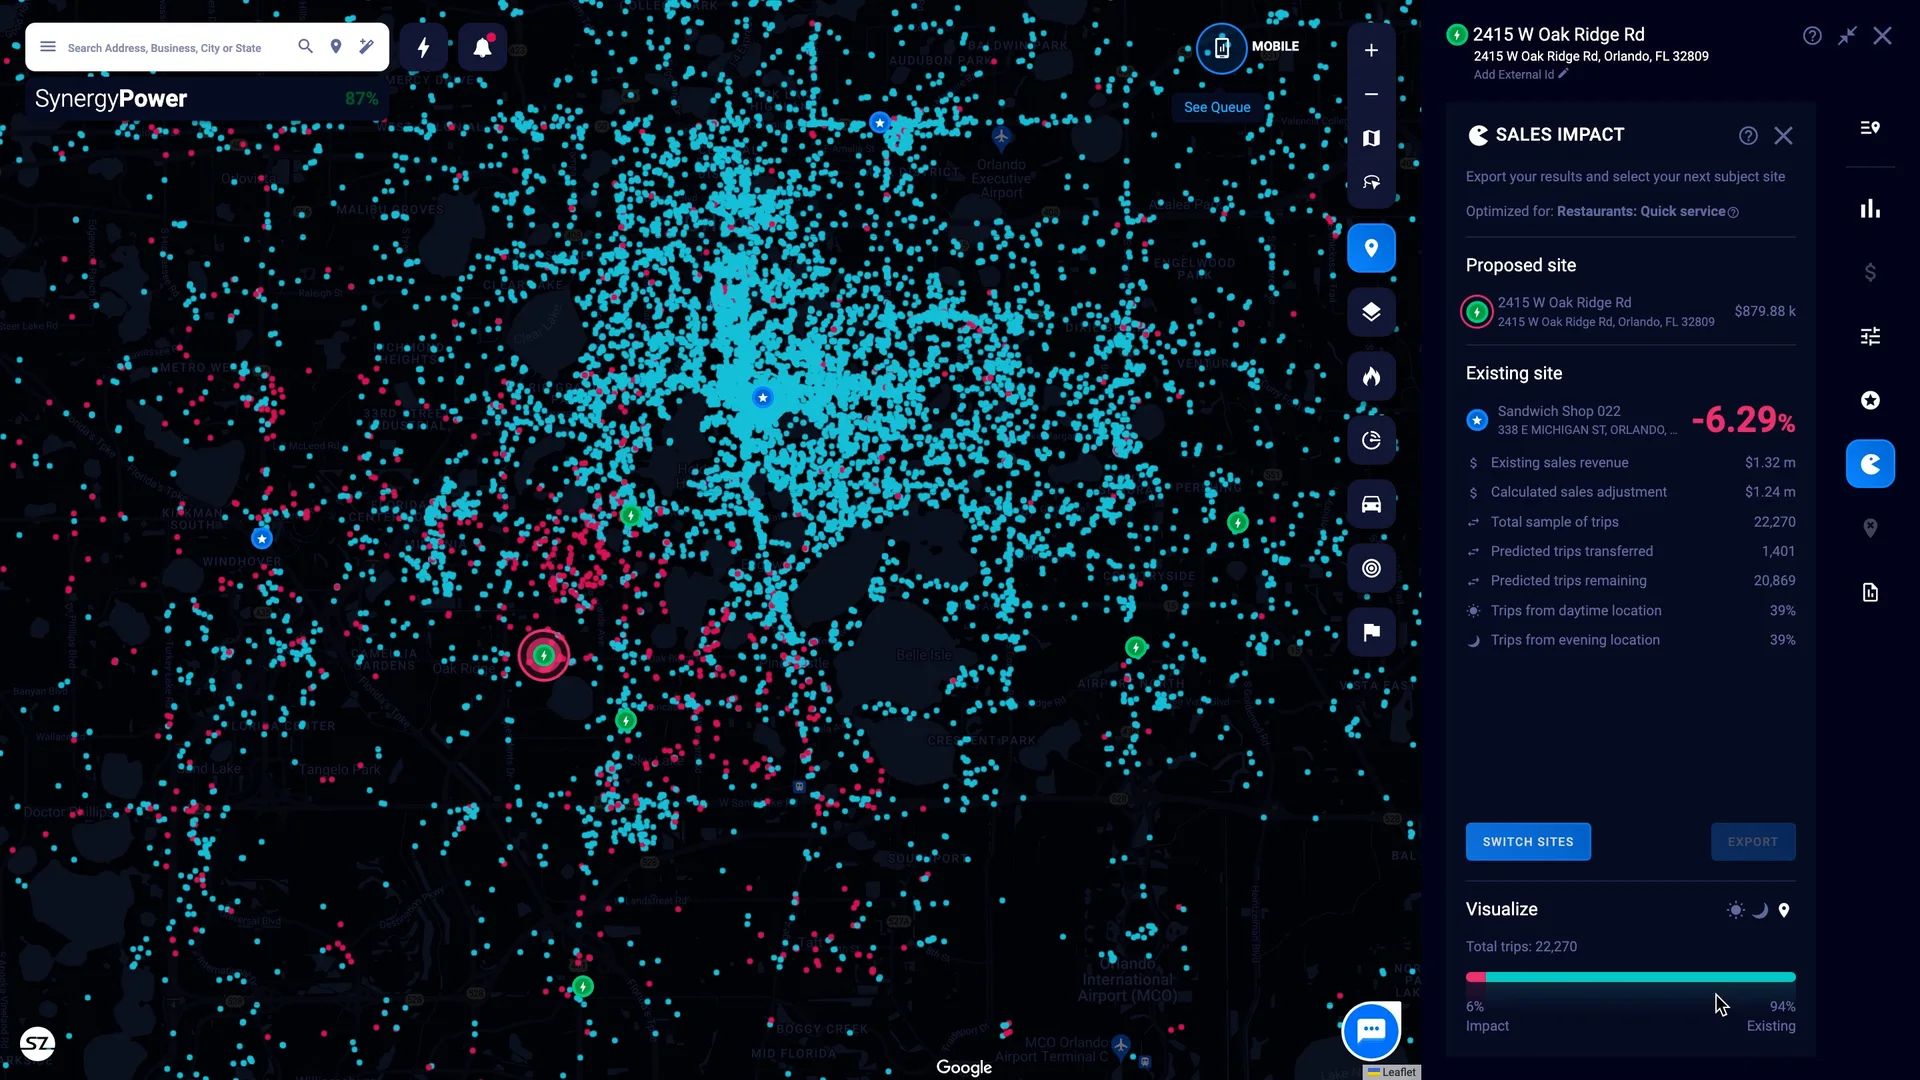
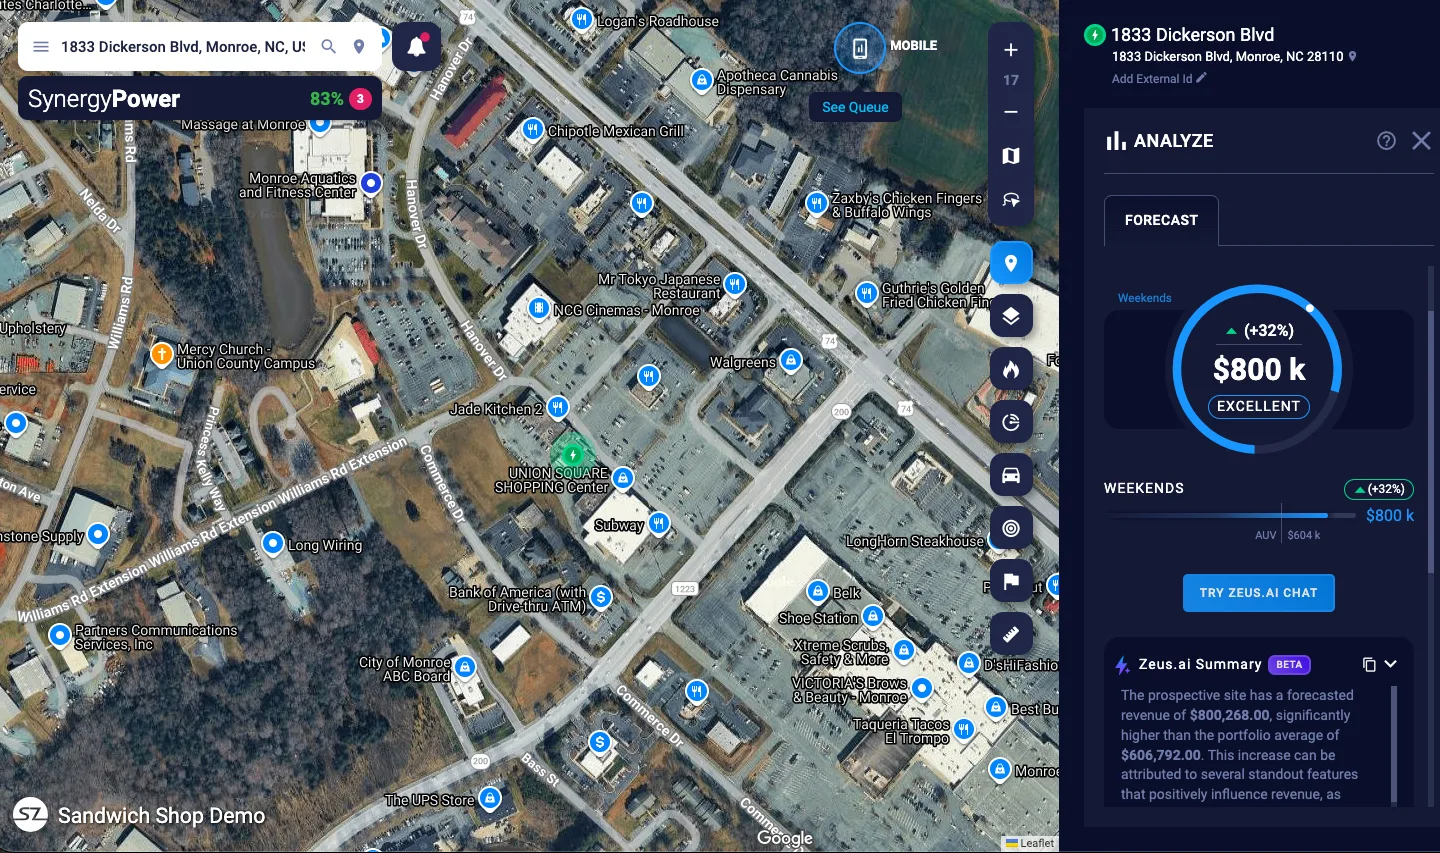
Make confident site selection decisions
AI-powered site selection software that delivers fast, accurate, and transparent sales forecasts. Understand what drives performance, compare sites quickly, and make confident expansion decisions.

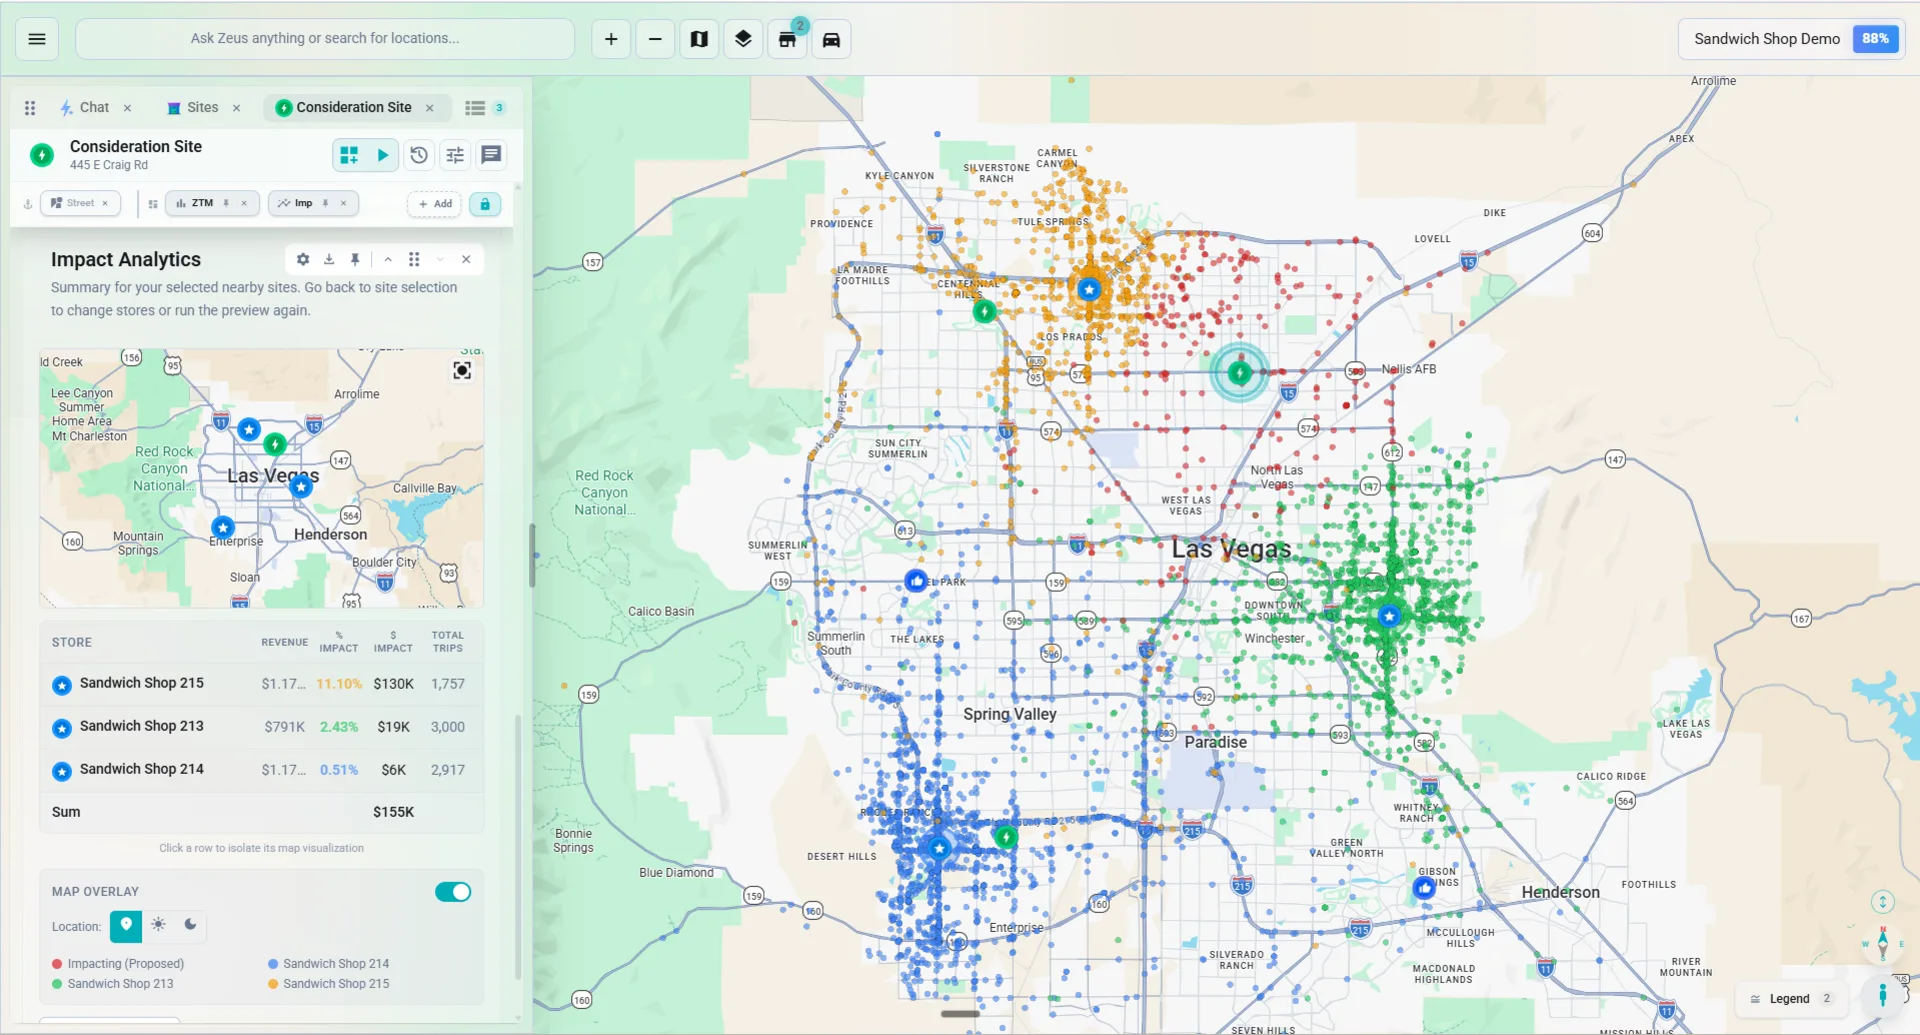
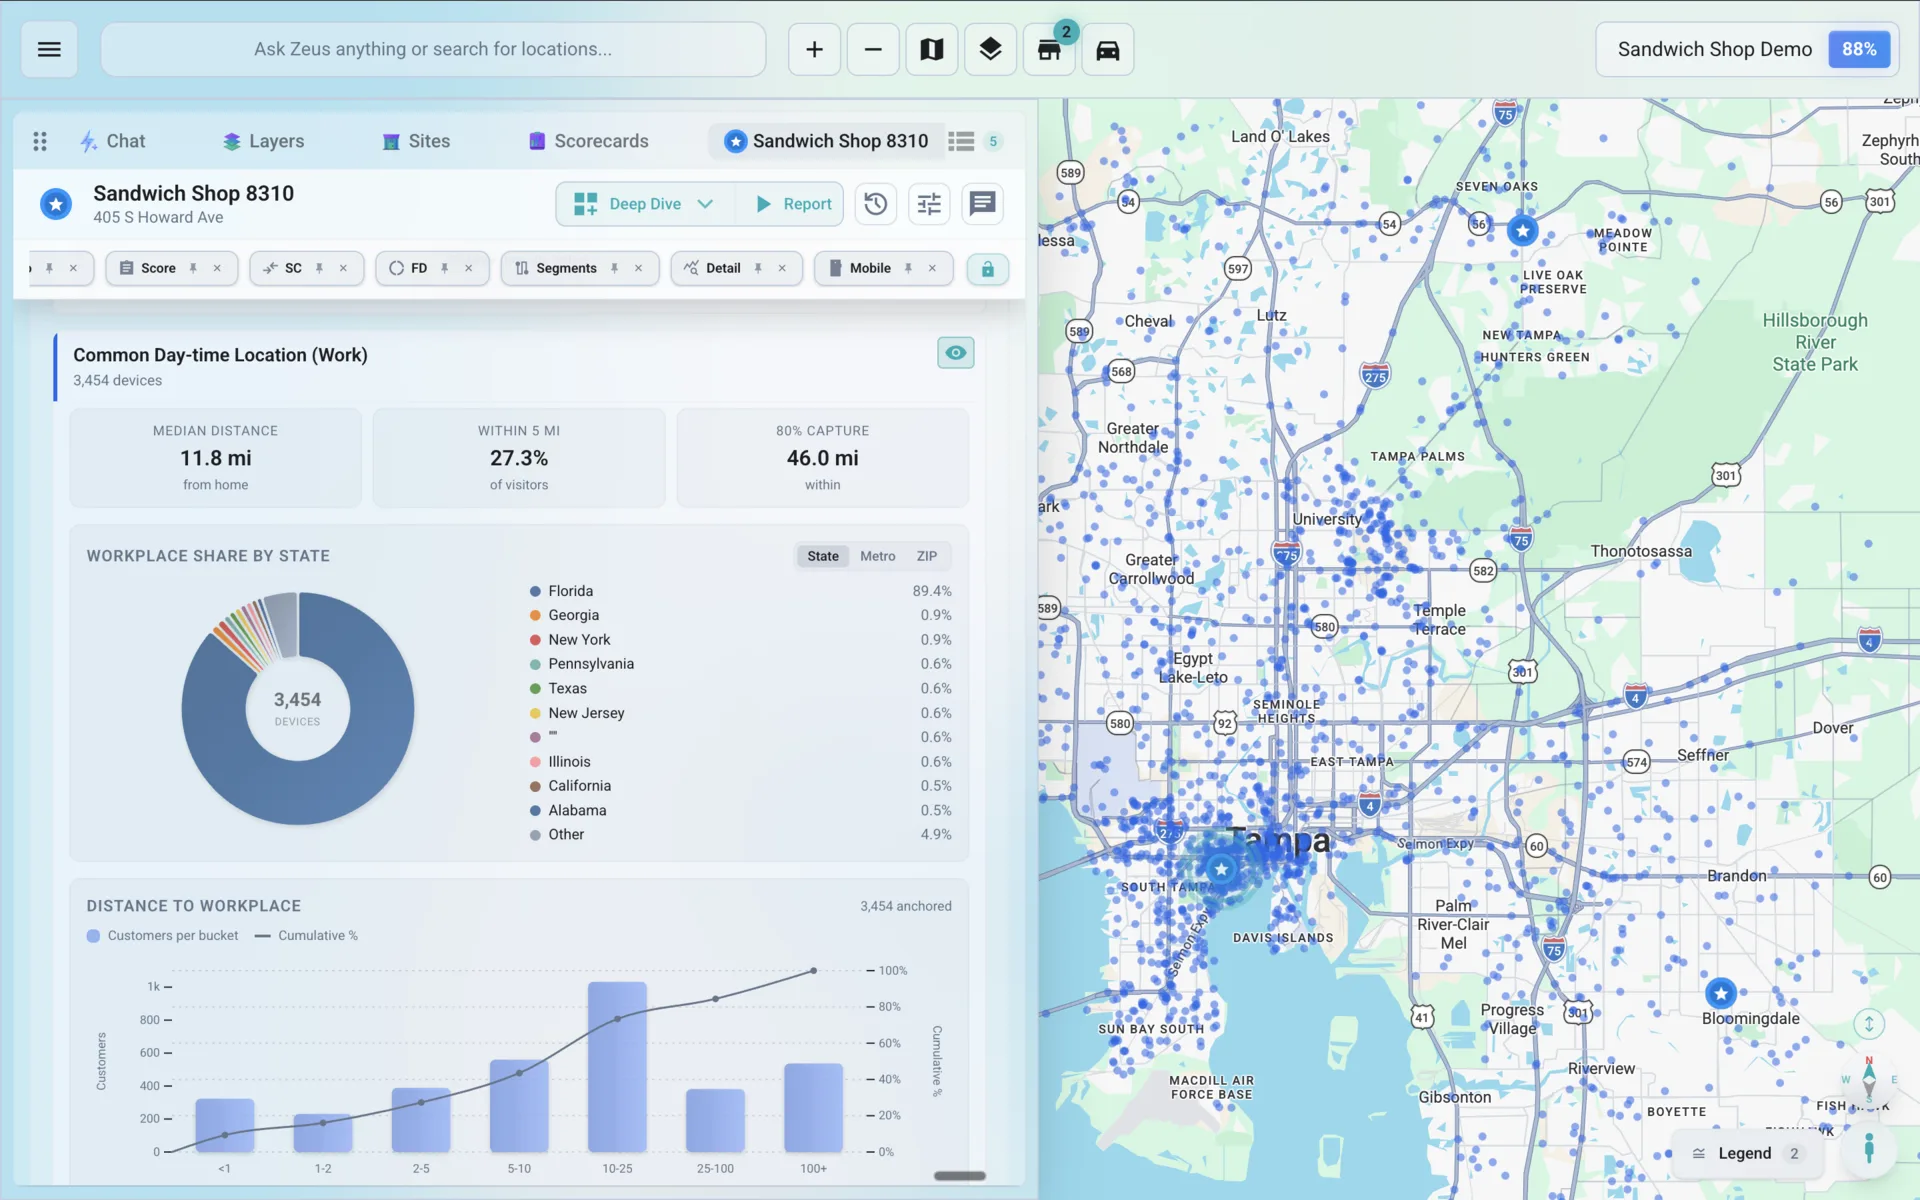
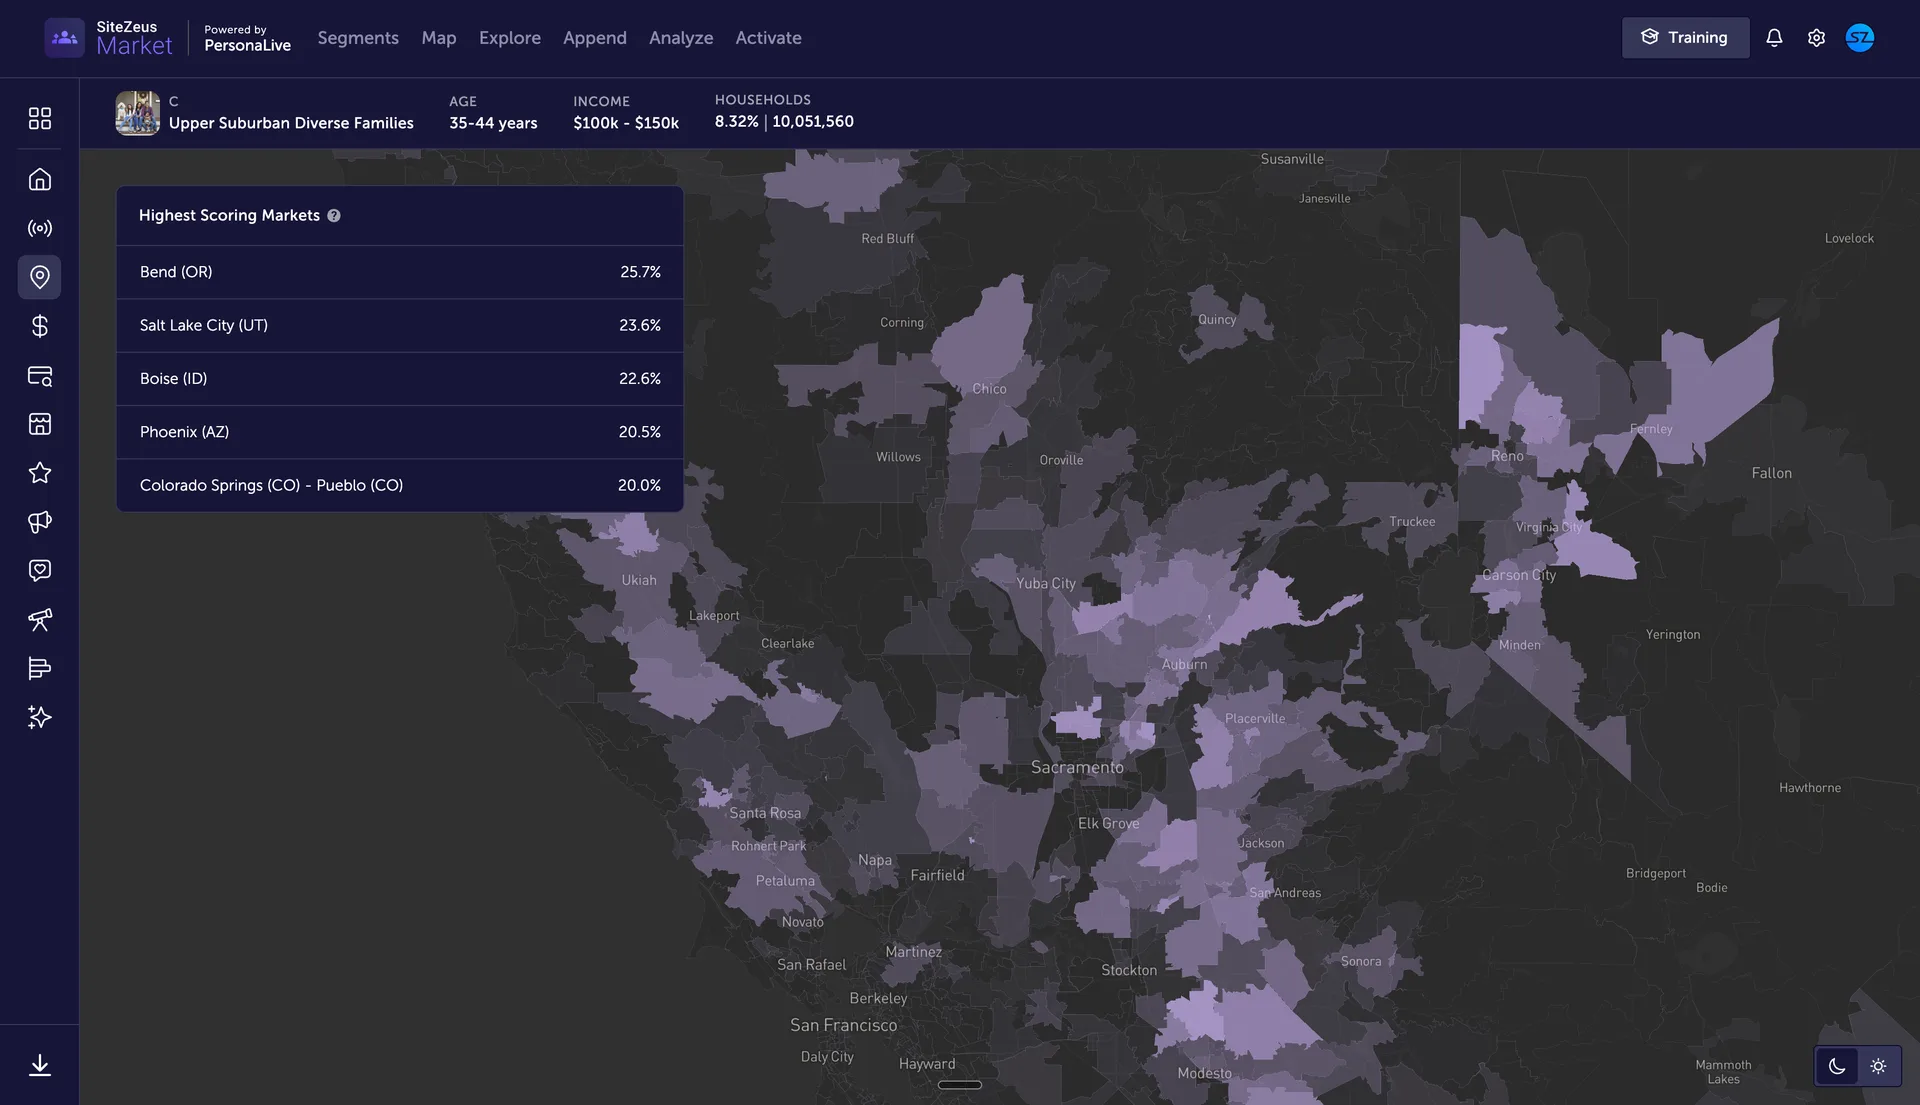
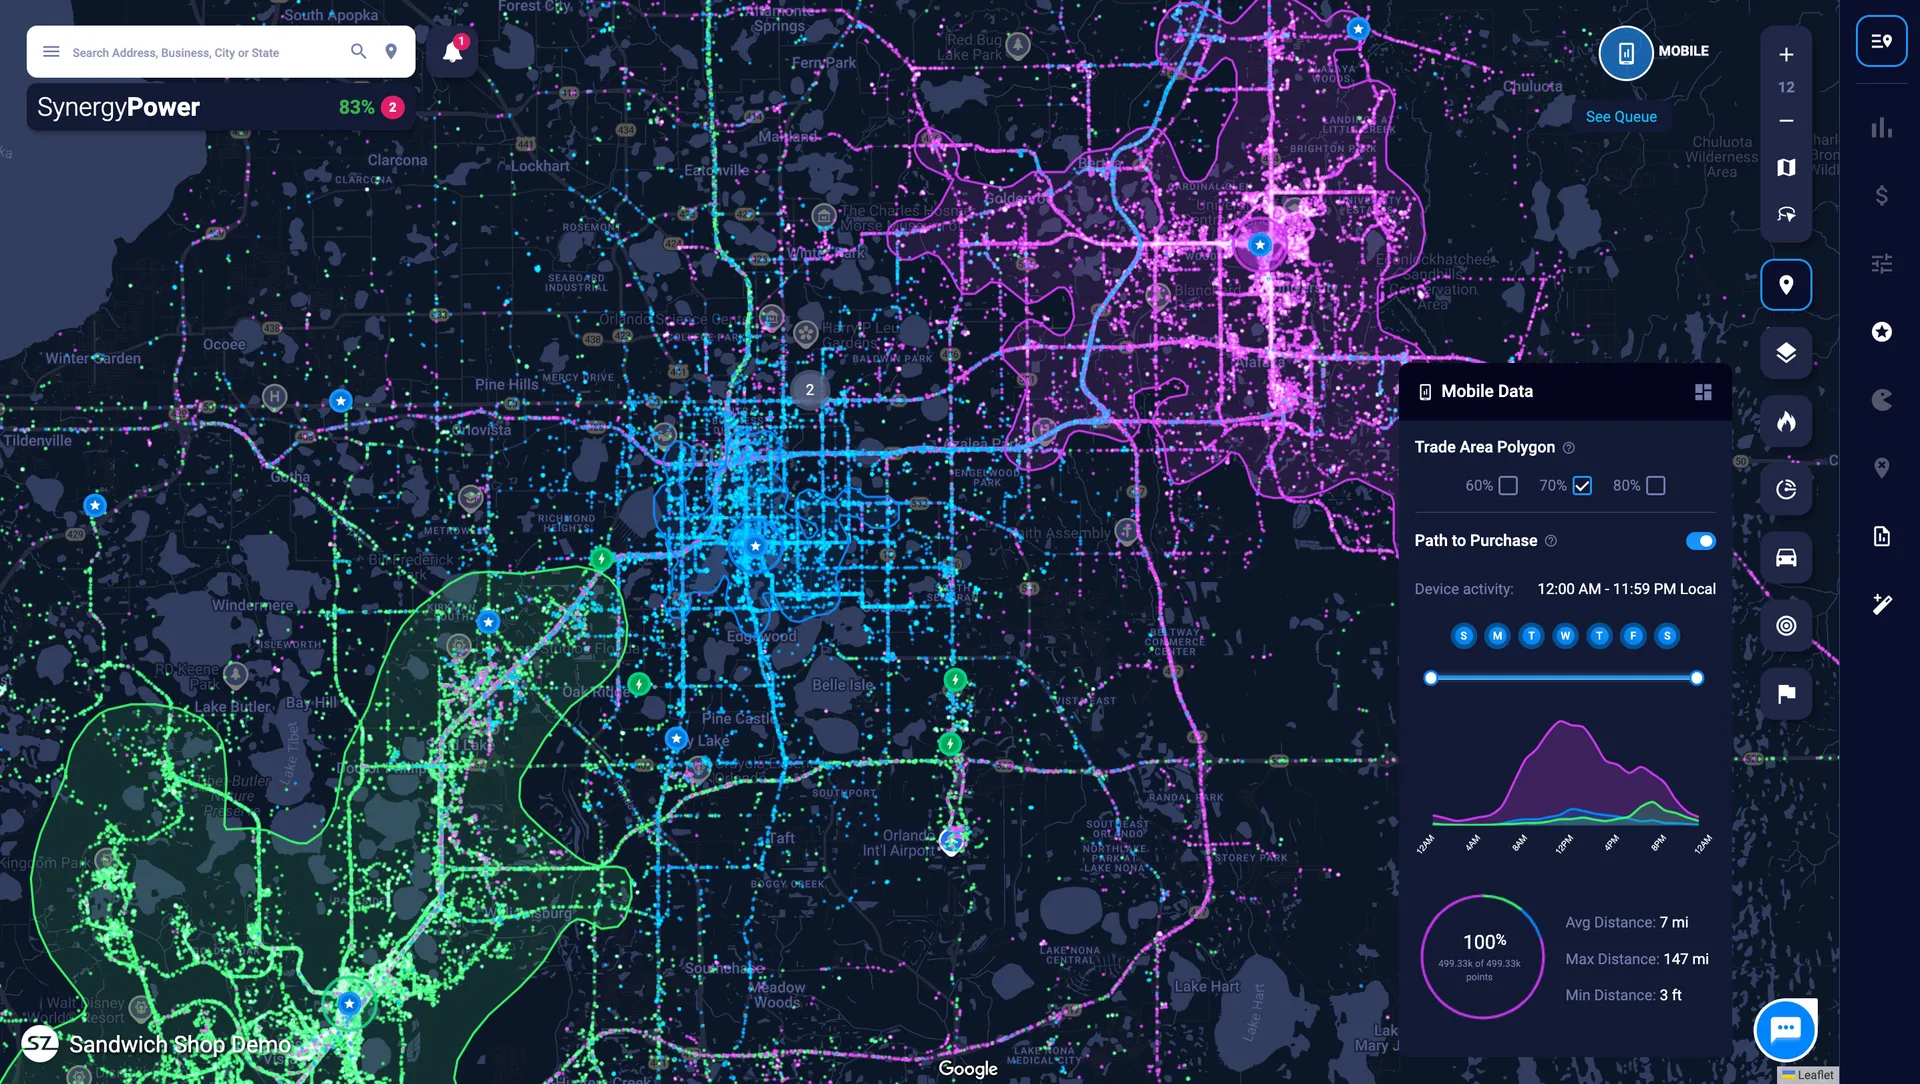
Find your actual best customers
Deep visibility into who your customers are, where they come from, and how they move. Use real behavioral data to uncover demand, refine trade areas, and choose locations that align with your true customer footprint.
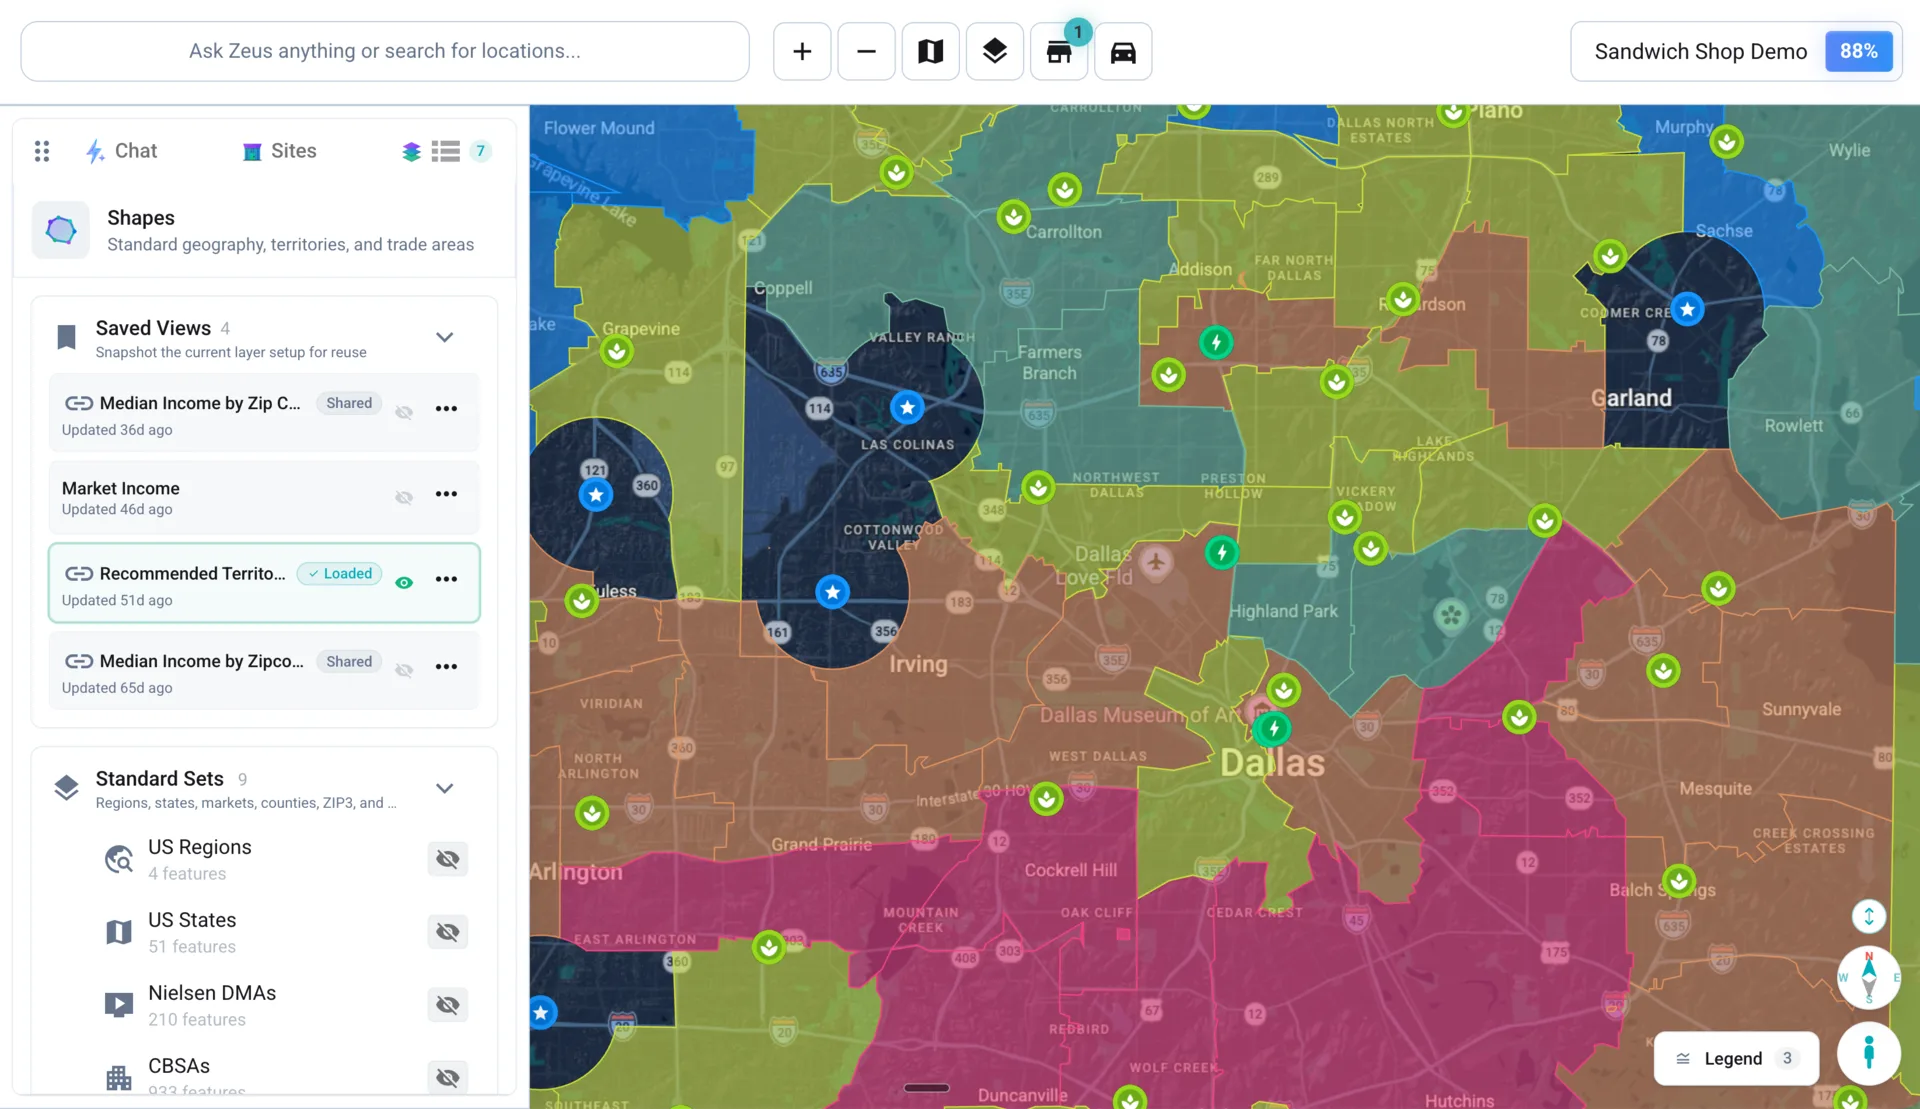
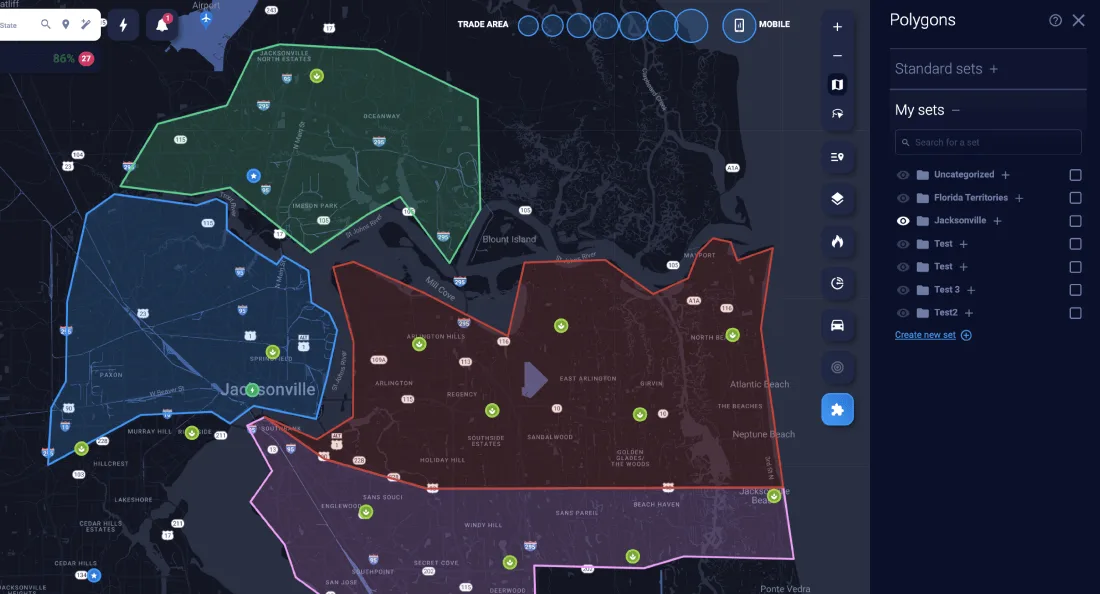
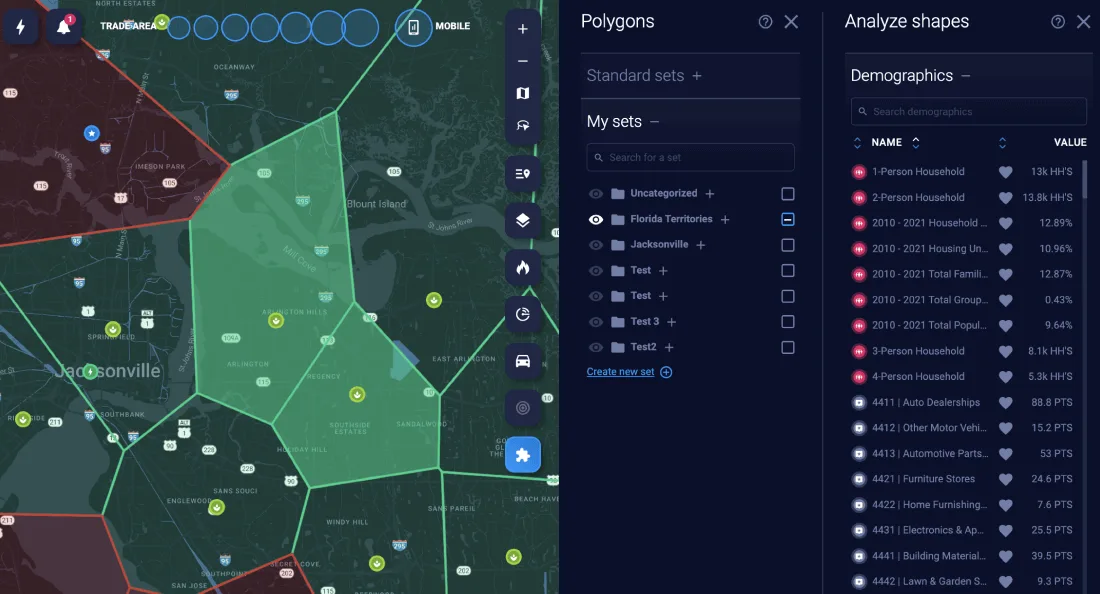
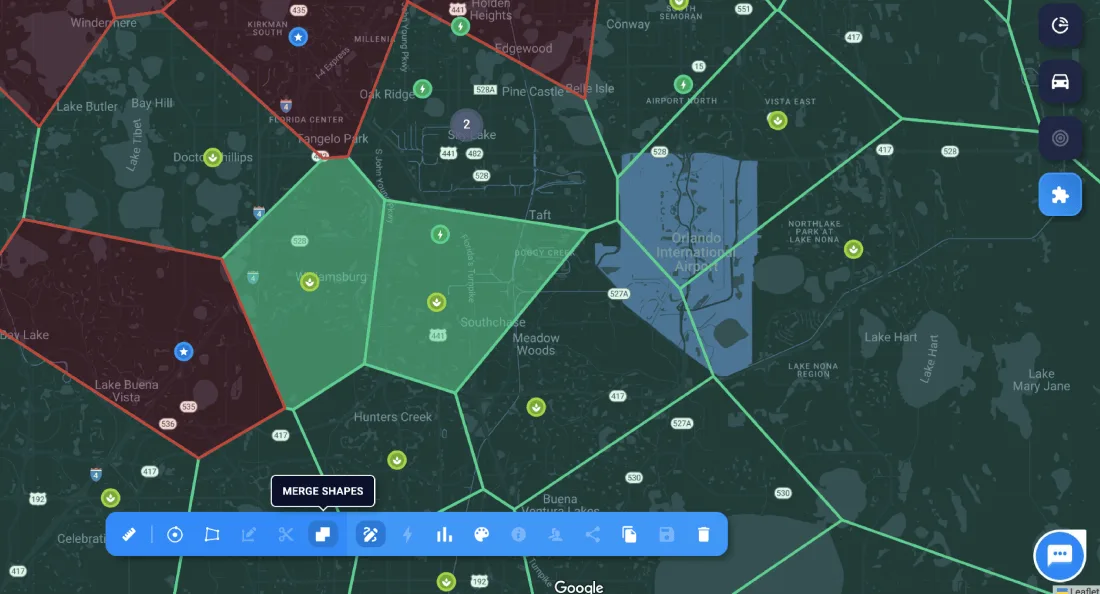
Plan and optimize your territories
Intuitive tools solution for designing, analyzing, and refining territory shapes. Evaluate territory performance, understand coverage and utilization, and identify where new territories are needed to guide smarter expansion planning.
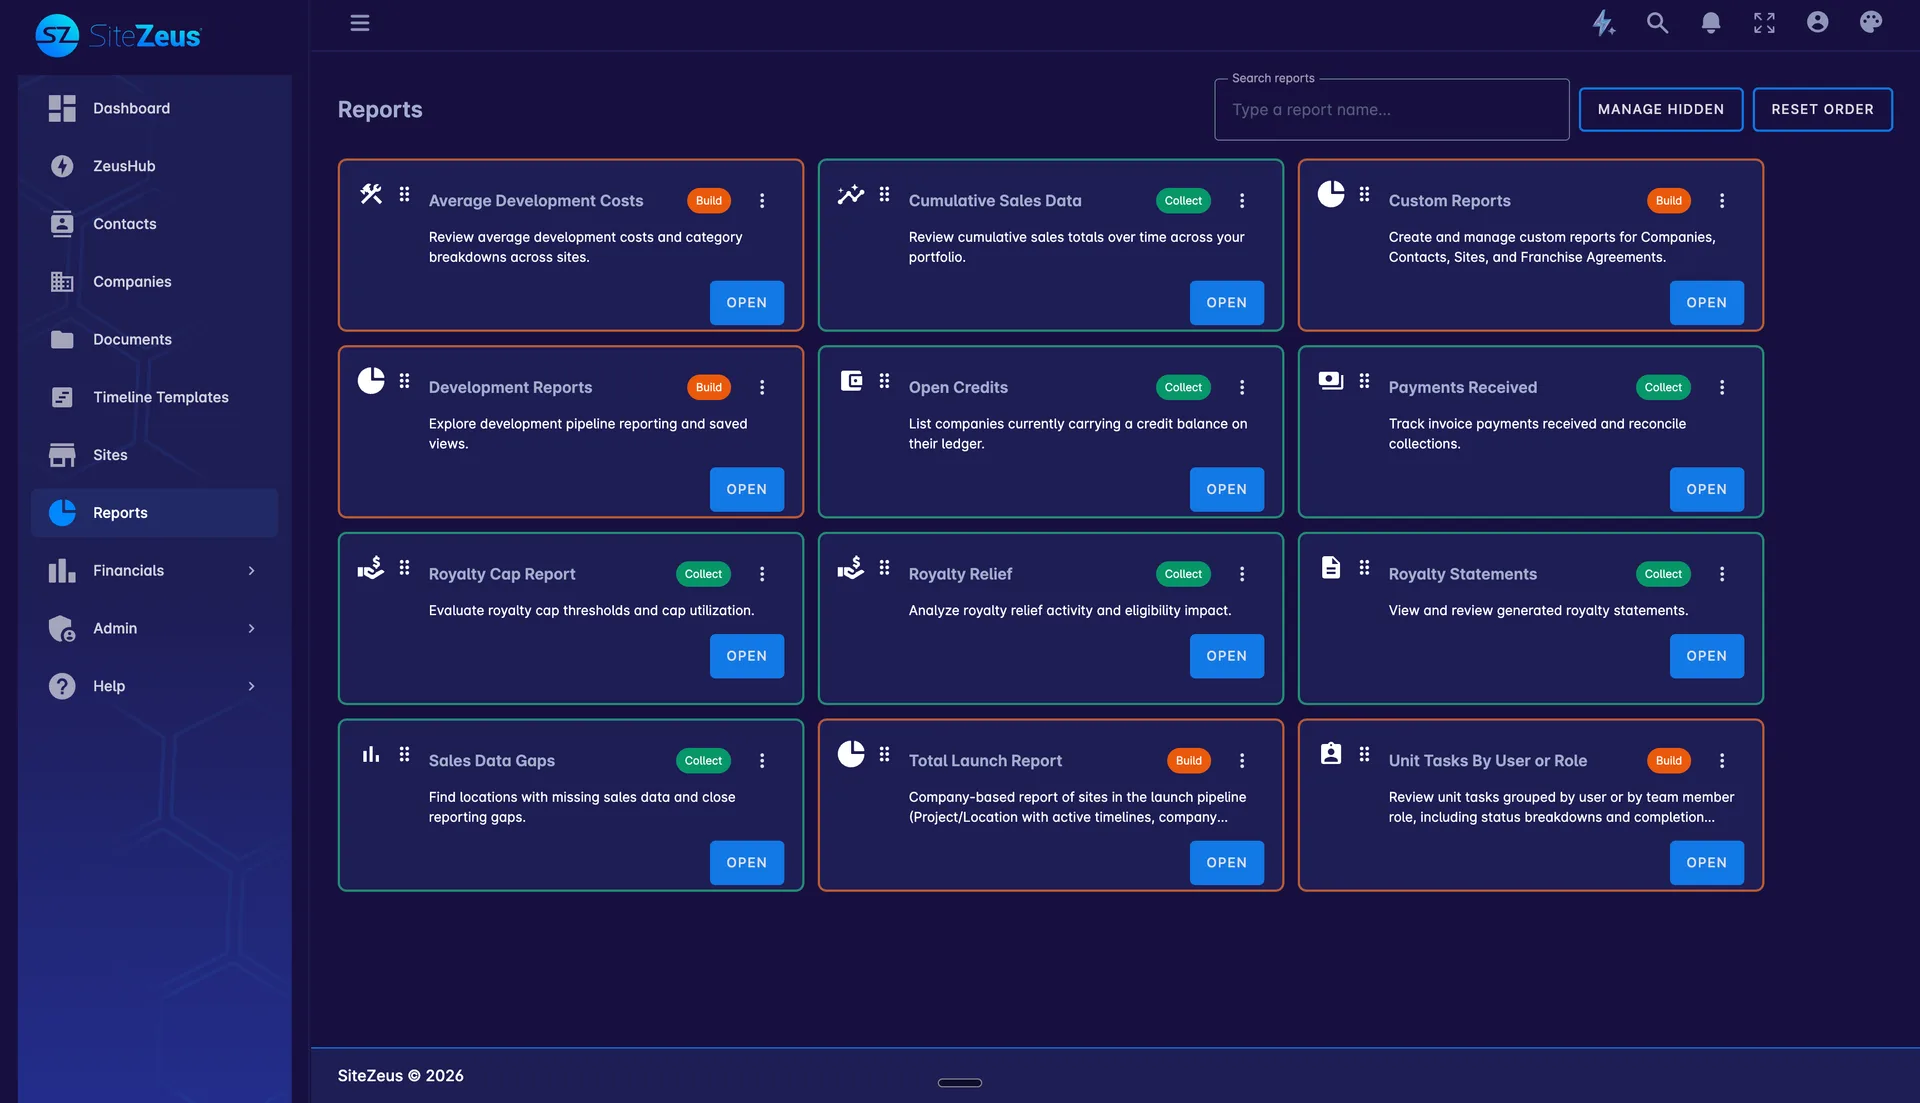
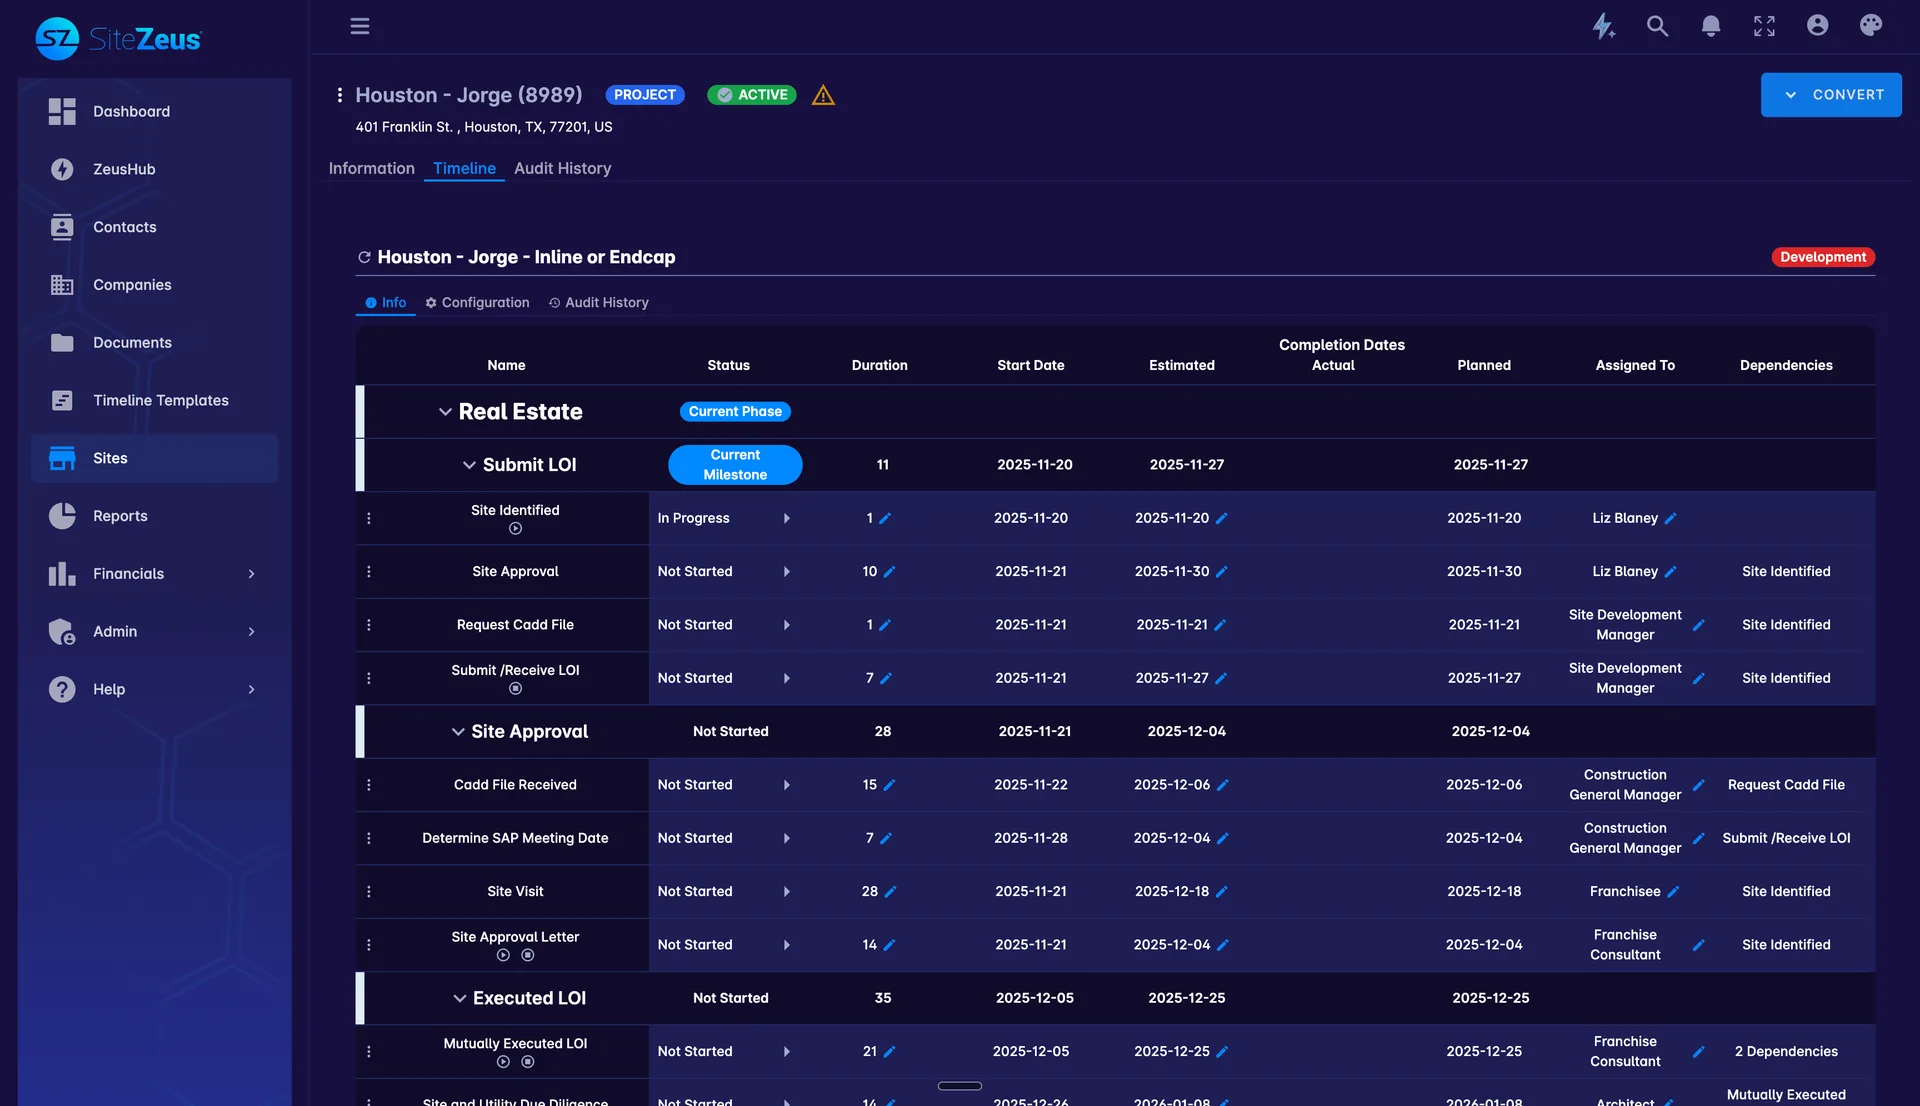
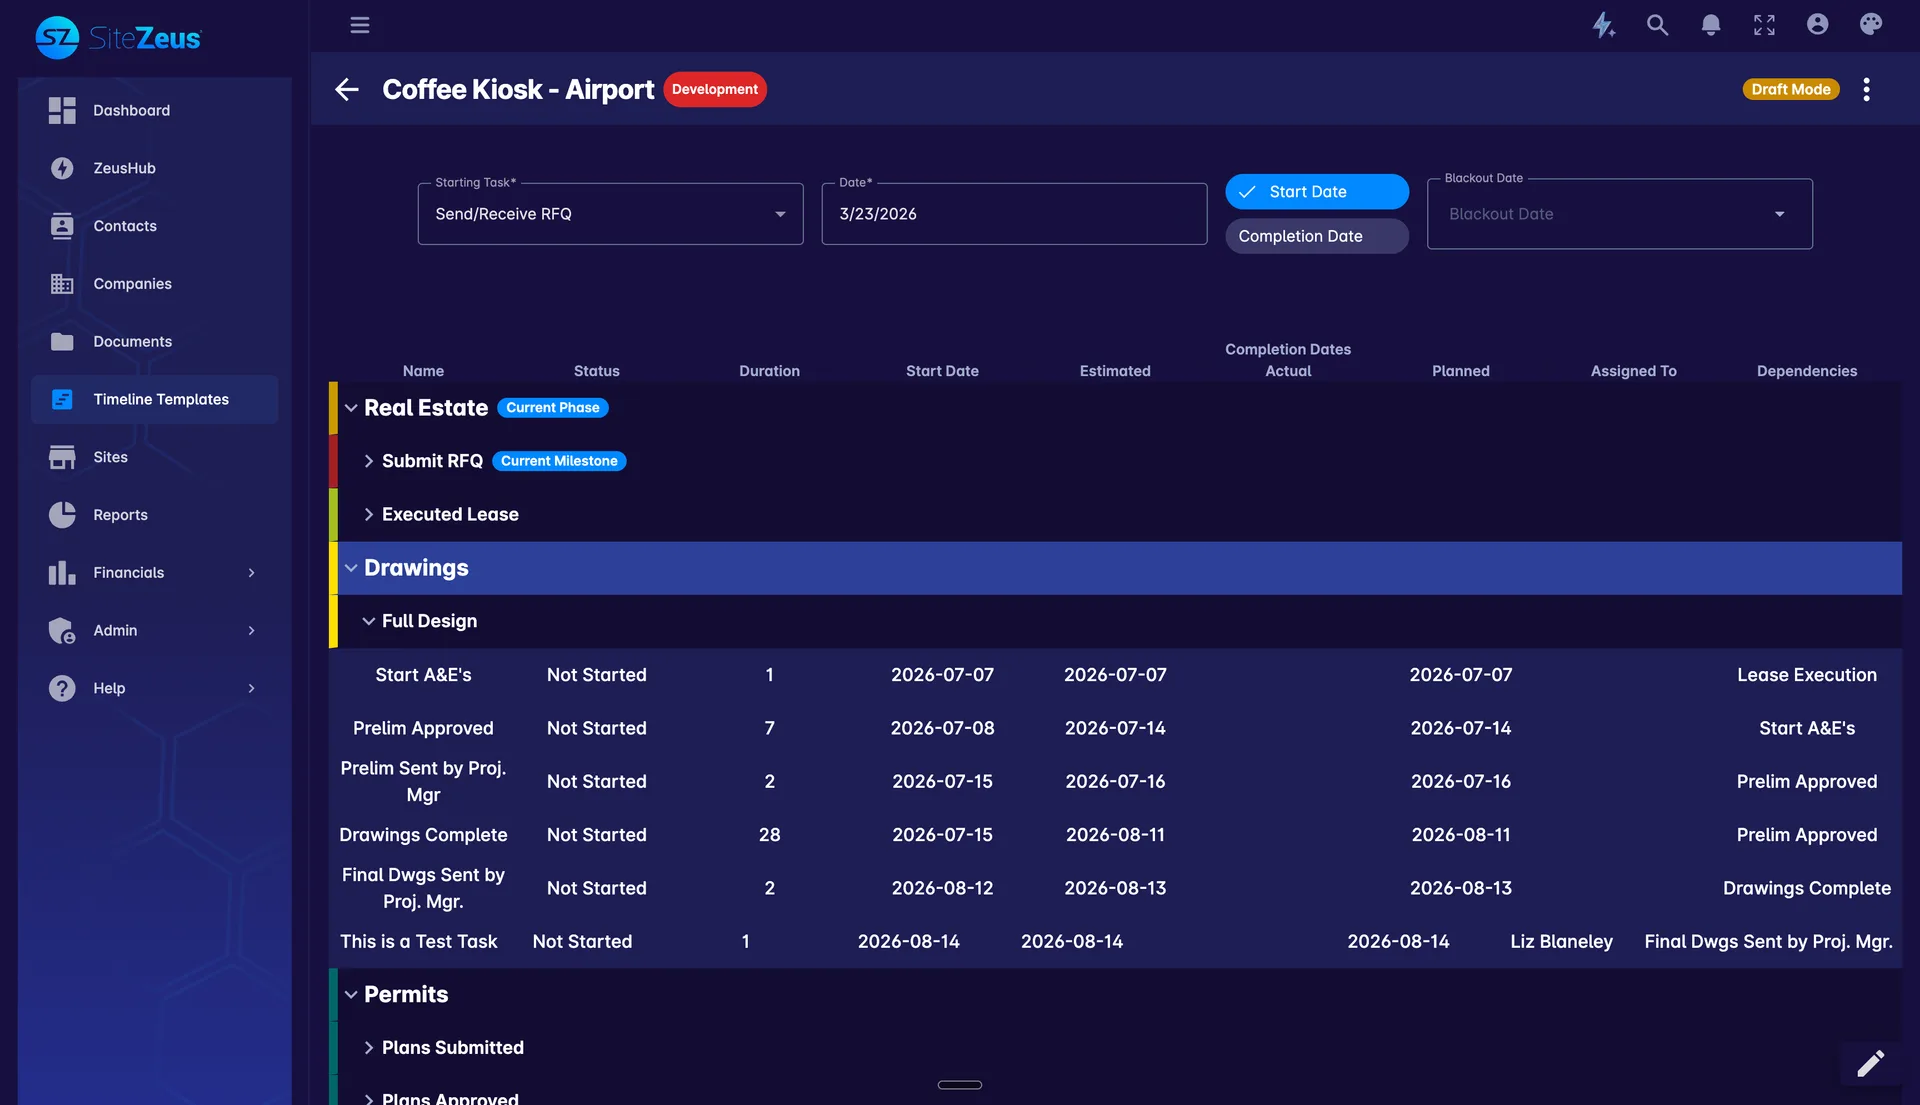
Keep every unit opening on track
A centralized system for managing unit openings, tracking budgets, and storing all location information. Keep teams aligned, milestones on track, and every detail documented from deal to opening day.
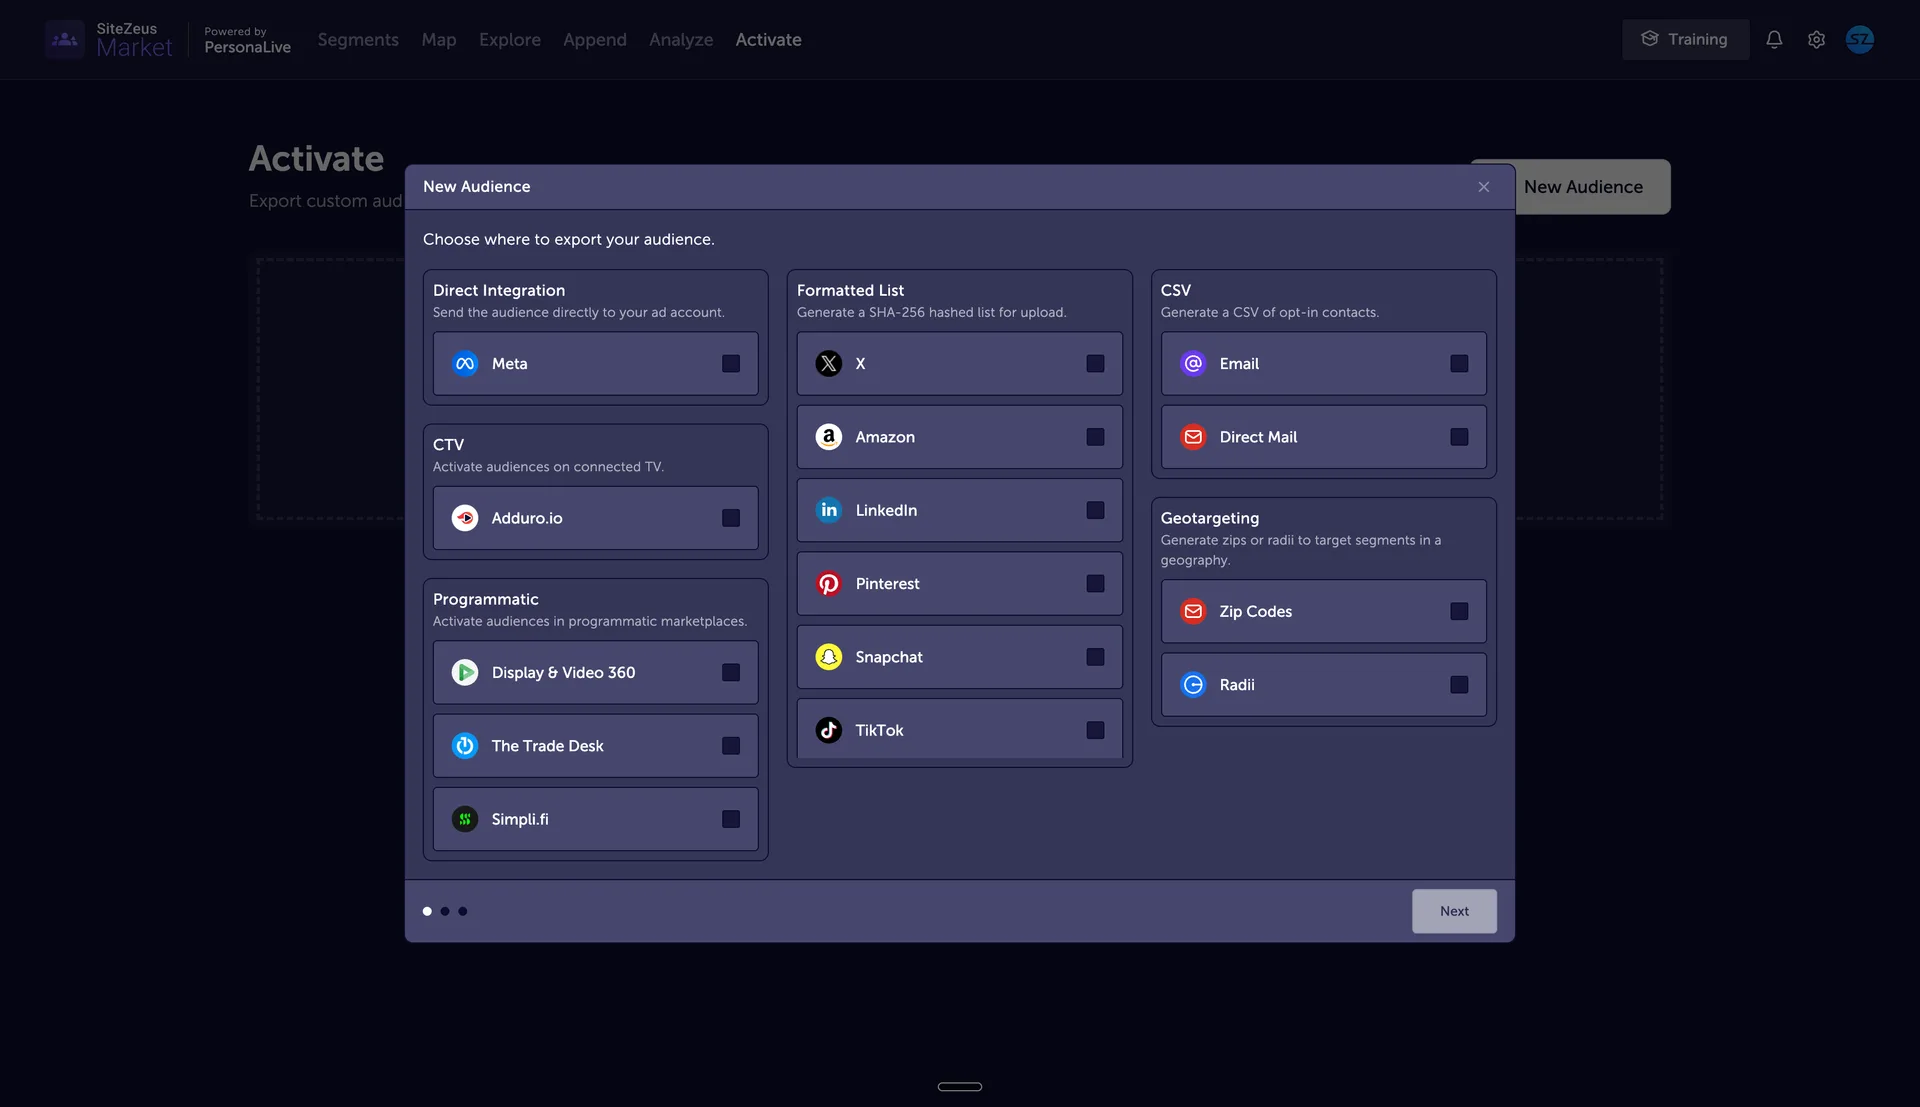
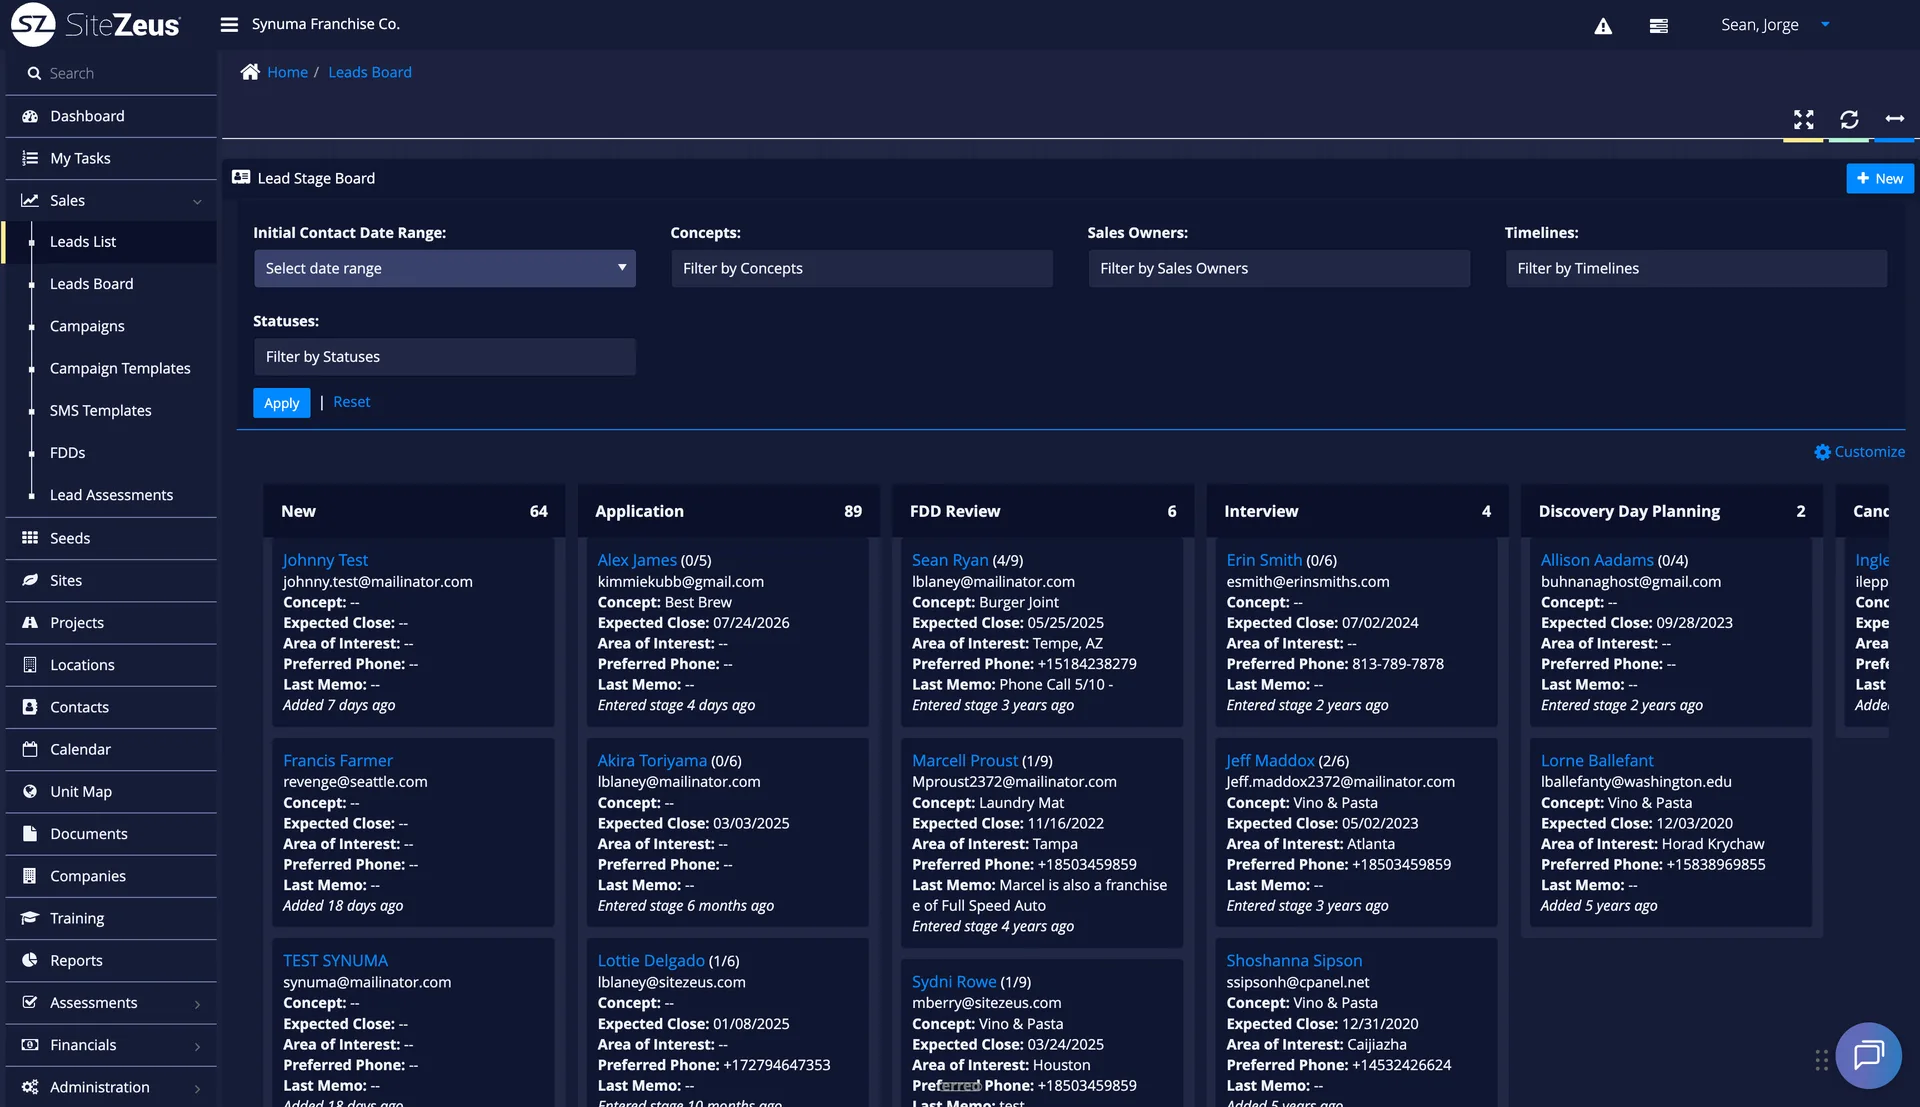
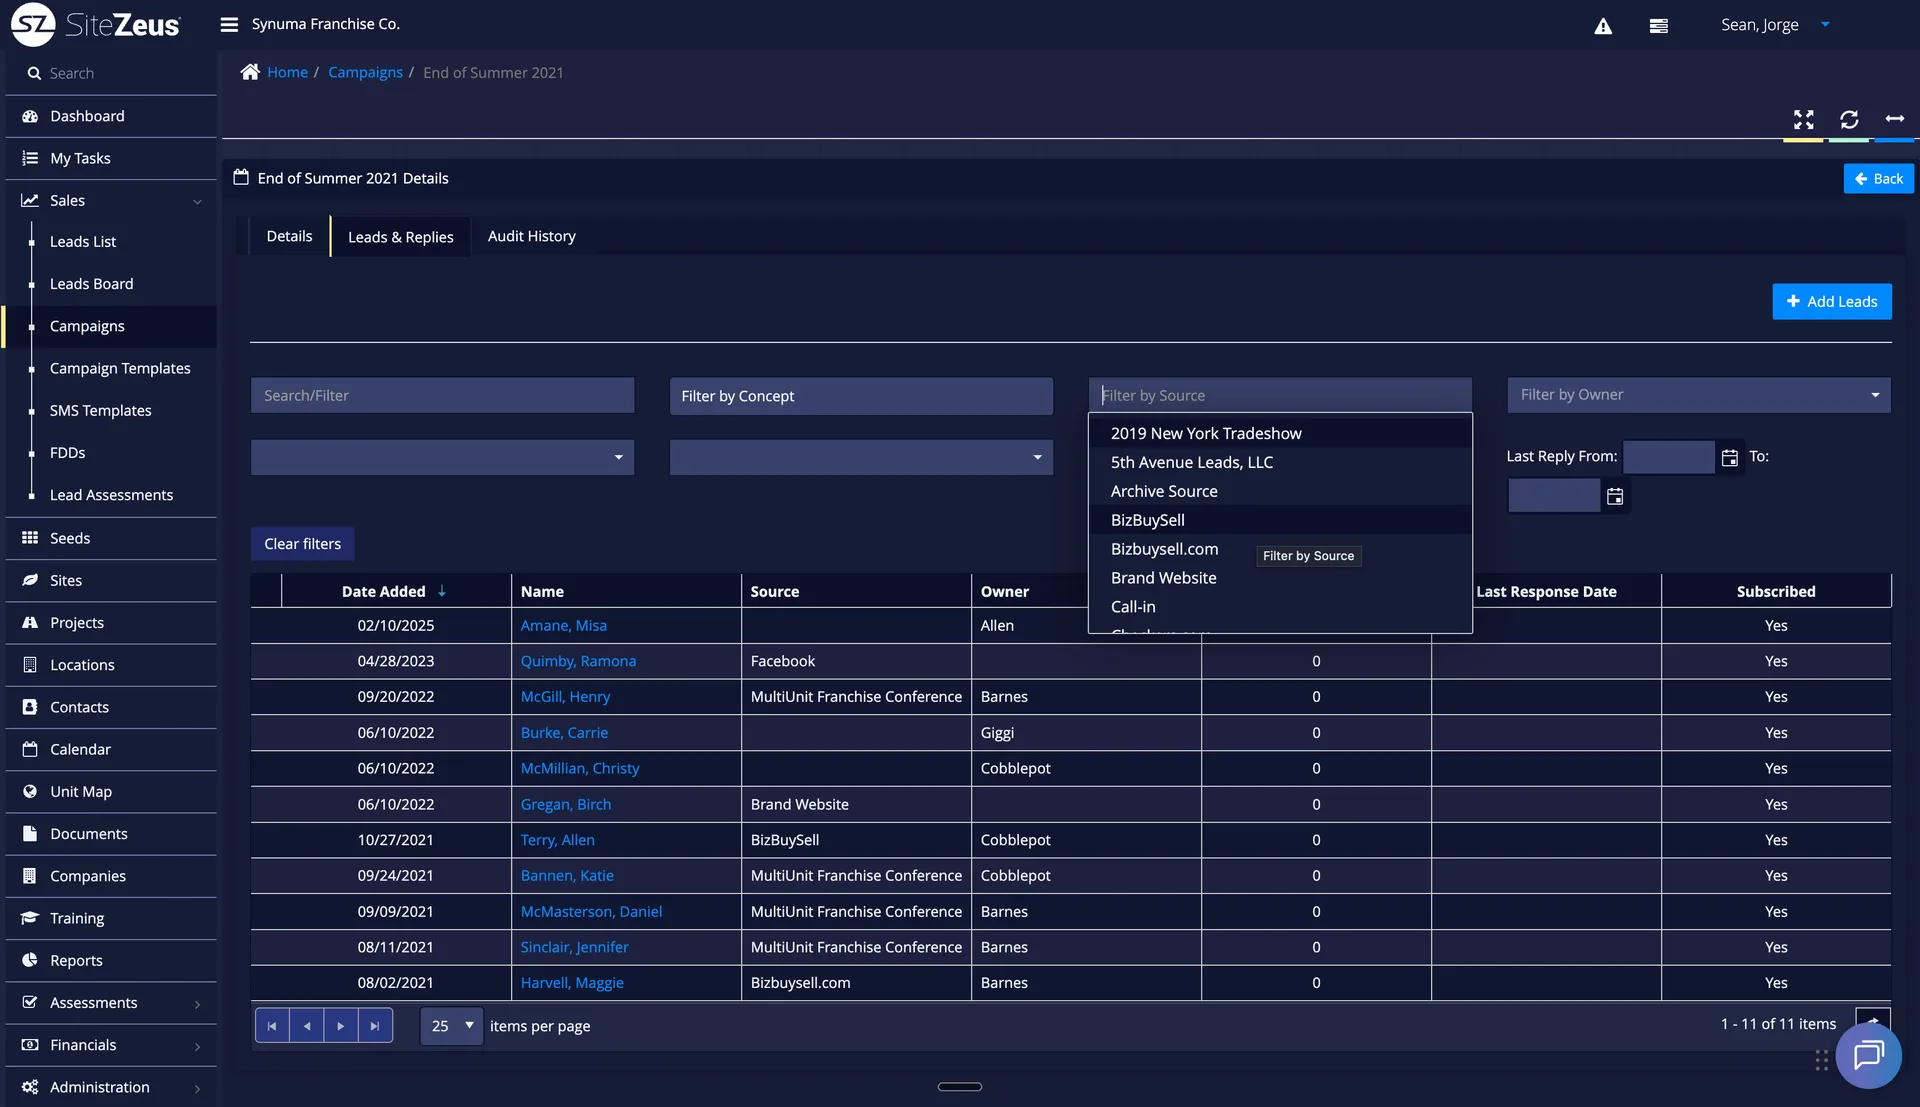
Manage and grow your franchise pipeline
A user-friendly CRM designed for franchise growth. Manage your pipeline, track candidates, and oversee territory assignments while keeping franchise sales aligned with your expansion strategy.
Solutions for every industry
Don't see your industry? Schedule a demo to learn about custom solutions for you
Schedule a demo
See how SiteZeus can help your brand grow smarter with AI-powered site selection, customer insights, and more.
No commitment required. We'll reach out within one business day.
What our clients say
"We approach our analytical tools as an investment into making sure that we are minimizing risk, and that we are setting up and making the best decisions possible for new restaurants for long-term success, so we started working with SiteZeus. We're always trying to get a little less wrong every day and I'm excited to see what our model will look like a year from now as I know we'll continue to see more improvement. I appreciate that the SiteZeus team has the flexibility and willingness to step back and understand our challenges, how we look at the model and its outputs, and how we use it for our business. It has been a great relationship."

Brandon Colby
Regional Director of Real Estate Strategy, Raising Cane's

"Since becoming a client of SiteZeus, we have had the pleasure of working with and learning from your team. From leveraging demographic data and modeling built around our business, to exploring mobile data and the use of the Market platform, we have been able to better understand how to evaluate and improve our site selection process, while also understanding the surrounding market for consumer engagement and local revenue growth. The support the SiteZeus team has provided has been nothing short of world class. SiteZeus has been a true partner in our growth and understanding of our consumers."

Anthony Pierce
Business Development Service Team, Pro Food Systems
"As we continue to ramp up our growth, SiteZeus has been a beneficial resource for the efficient evaluation of new markets. Having the right tools to drill down and study market penetration, cannibalization, mobile and other data points has been instrumental in our market analysis and site selection process. In today's real estate environment, it is critical to be able to prioritize markets, evaluate options quickly, and capitalize on the right sites at the right time. The SiteZeus support team has been a great partner as well, providing quick responses as needed."
Lee Easley
Real Estate Manager, Biscuitville
"We wanted a single solution. Having territory management included was important for us so we could analyze, review, and map where our stores were, which territories were available, and how many stores each territory could accommodate."
Dannon Shiff
Senior Vice President of Real Estate, Dave's Hot Chicken
"The SiteZeus platform gives our firm an important competitive advantage. It allows our team and our restaurant partners to identify growth opportunities incredibly fast. We can also lean on the data to support good, quantifiable decisions."
Jeff DeVolder
Managing Director, Vantedge
"Our partnership with SiteZeus will help us serve the best pizza in the world to a lot more people. SiteZeus' platform will fuel our growth by helping us scout sites, identify markets, and learn about the communities we aim to serve."
Sasha Milosavljevich
Chief Real Estate Officer, Lou Malnati's
"We approach our analytical tools as an investment into making sure that we are minimizing risk, and that we are setting up and making the best decisions possible for new restaurants for long-term success, so we started working with SiteZeus. We're always trying to get a little less wrong every day and I'm excited to see what our model will look like a year from now as I know we'll continue to see more improvement. I appreciate that the SiteZeus team has the flexibility and willingness to step back and understand our challenges, how we look at the model and its outputs, and how we use it for our business. It has been a great relationship."
Brandon Colby
Regional Director of Real Estate Strategy, Raising Cane's
"Since becoming a client of SiteZeus, we have had the pleasure of working with and learning from your team. From leveraging demographic data and modeling built around our business, to exploring mobile data and the use of the Market platform, we have been able to better understand how to evaluate and improve our site selection process, while also understanding the surrounding market for consumer engagement and local revenue growth. The support the SiteZeus team has provided has been nothing short of world class. SiteZeus has been a true partner in our growth and understanding of our consumers."
Anthony Pierce
Business Development Service Team, Pro Food Systems
"As we continue to ramp up our growth, SiteZeus has been a beneficial resource for the efficient evaluation of new markets. Having the right tools to drill down and study market penetration, cannibalization, mobile and other data points has been instrumental in our market analysis and site selection process. In today's real estate environment, it is critical to be able to prioritize markets, evaluate options quickly, and capitalize on the right sites at the right time. The SiteZeus support team has been a great partner as well, providing quick responses as needed."
Lee Easley
Real Estate Manager, Biscuitville
"We wanted a single solution. Having territory management included was important for us so we could analyze, review, and map where our stores were, which territories were available, and how many stores each territory could accommodate."
Dannon Shiff
Senior Vice President of Real Estate, Dave's Hot Chicken
"The SiteZeus platform gives our firm an important competitive advantage. It allows our team and our restaurant partners to identify growth opportunities incredibly fast. We can also lean on the data to support good, quantifiable decisions."
Jeff DeVolder
Managing Director, Vantedge
"Our partnership with SiteZeus will help us serve the best pizza in the world to a lot more people. SiteZeus' platform will fuel our growth by helping us scout sites, identify markets, and learn about the communities we aim to serve."
Sasha Milosavljevich
Chief Real Estate Officer, Lou Malnati's