The Olympus Data Exchange
supercharge your data
The Olympus Data Exchange grants you direct access to the world's most trusted data sets. Designed to supplement your models for greater predictability, this analytics powerhouse is only a couple clicks away.
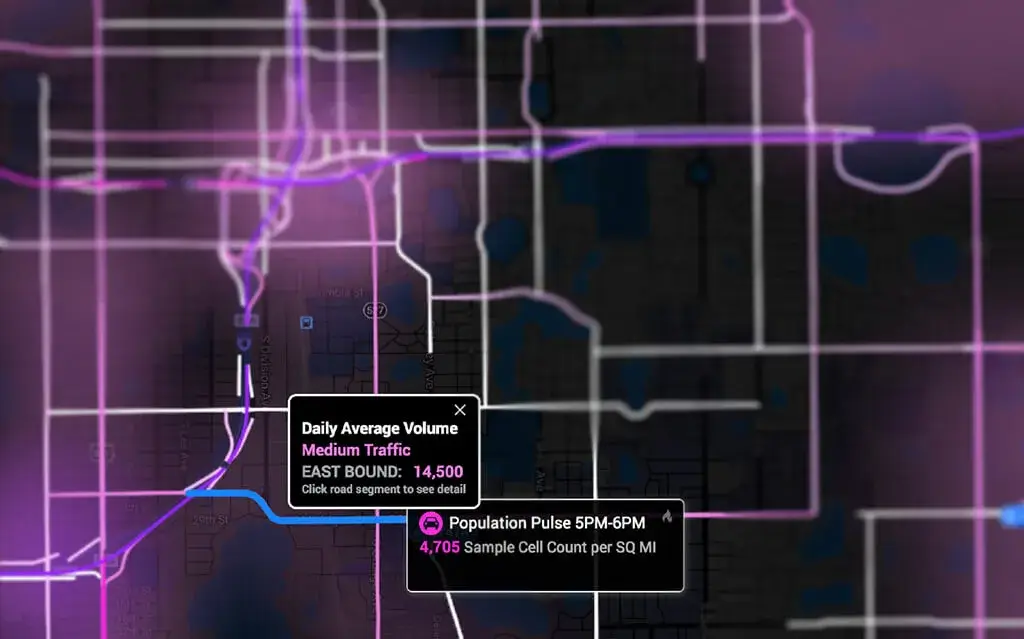

Traffic volume
What is inrix?
INRIX gathers population movement data from over 300 million mobile devices, vehicle GPSs, and Department of Transportation sites to deliver the only time-of-day and day-of-week traffic volume data separated by direction. With this data, you’ll never need to count cars again.


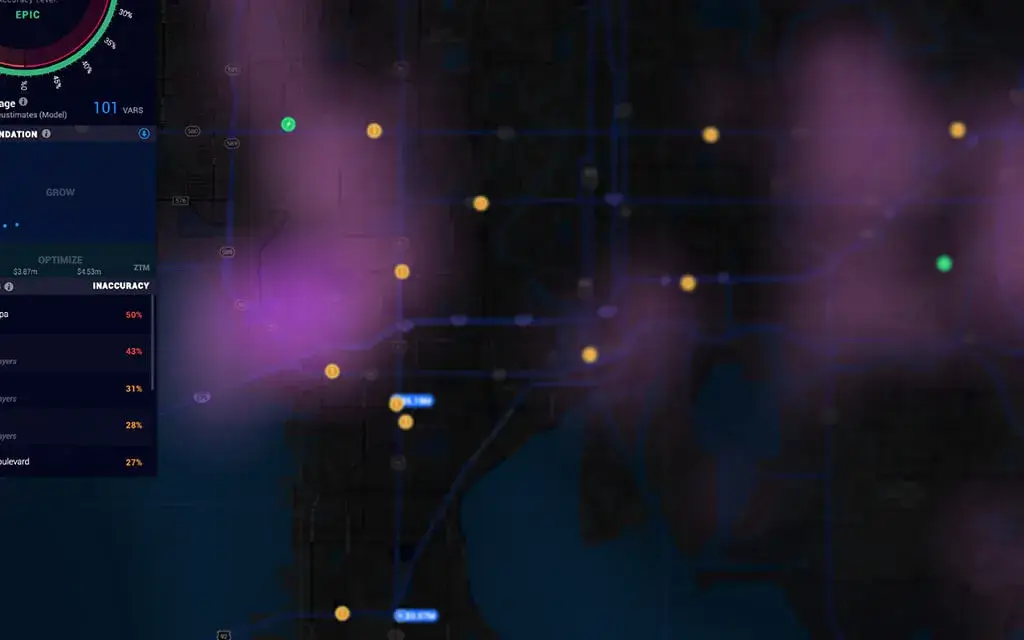
Mobile location Data
What is mobile location data?
Azira’s mobile location data tracks over 100 million active mobile devices in the United States. It allows you to visualize your customers' location two hours before and two hours after they enter a geofenced area. This excludes customers' homes and workplaces so that you can see their true path to purchase and visualize your location's trade area.
Population movement
What is population movement?
With data from nearly 400 million mobile devices in the United States, Azira gives you the highest-quality population movement data to help you analyze spatial trends in your trade area.
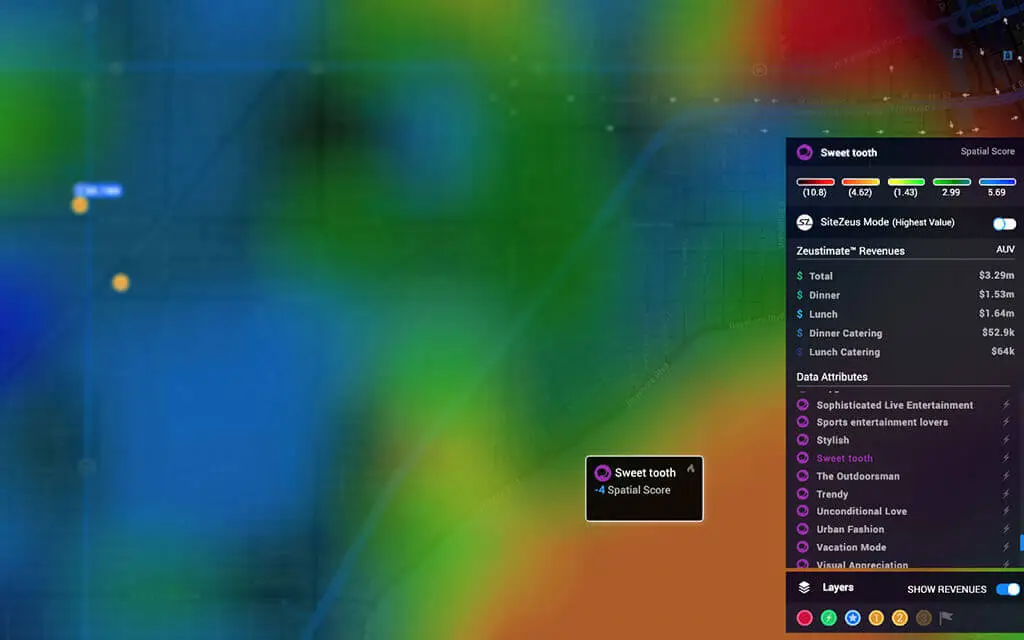

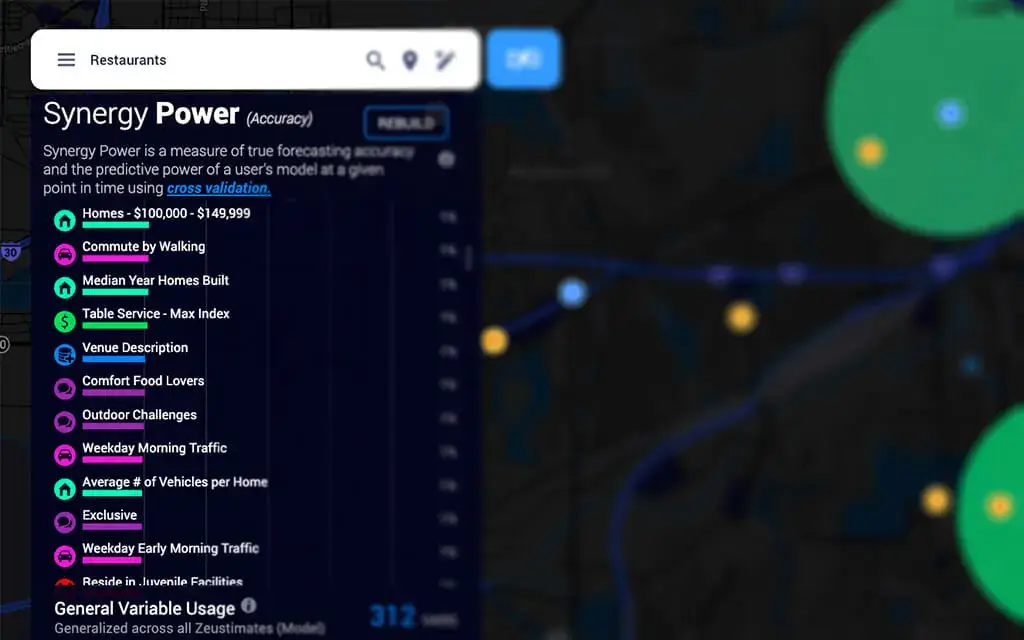
Geosocial segmentation
What is geosocial data?
Spatial.ai is a location-data company that creates social-based consumer segmentation profiles using billions of geotagged conversations from Twitter, Facebook, Instagram, Meetup and other social platforms. SiteZeus users can leverage 70 unique segments to study organic consumer behavior.
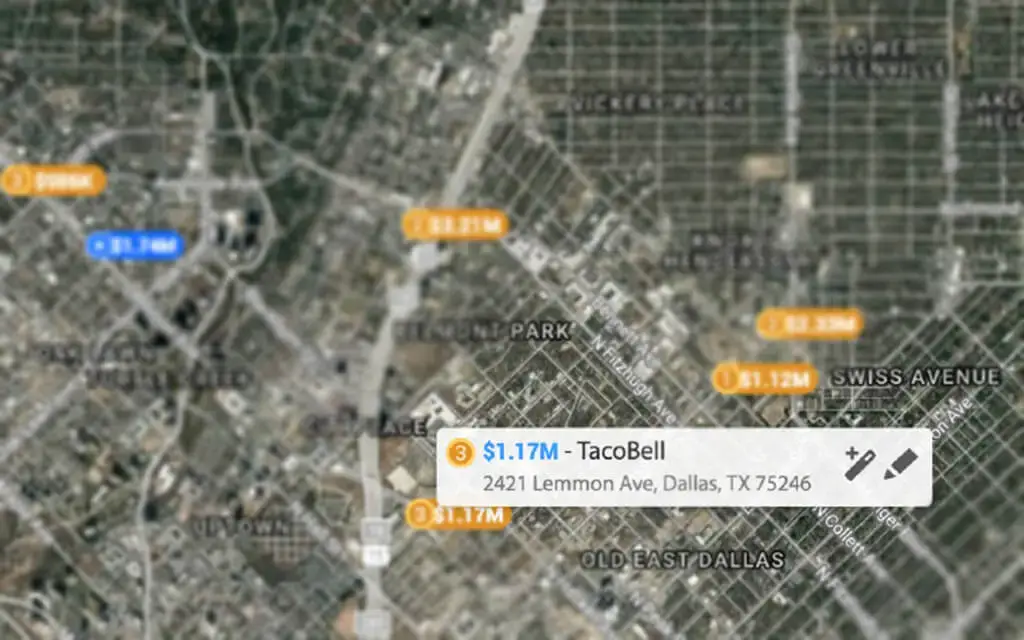

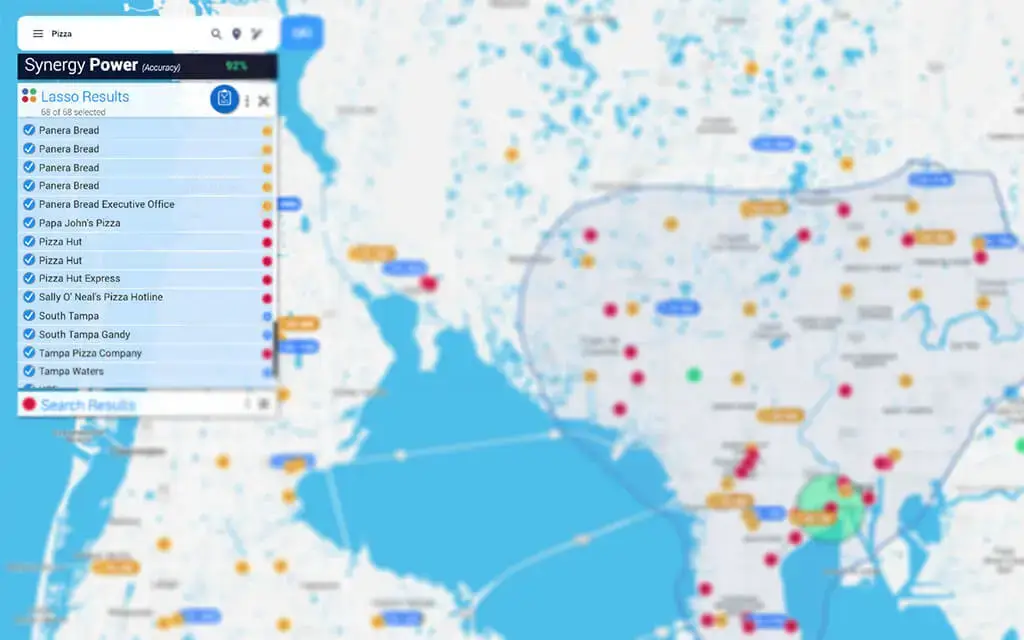
Restaurant sales
What is restaurant data?
For over 30 years, Restaurant Trends has been tracking quick- and full-service restaurants to provide store-level annual sales data and characteristics.

Household demographics
What is demographic data?
Claritas uses census data to provide detailed demographic data.
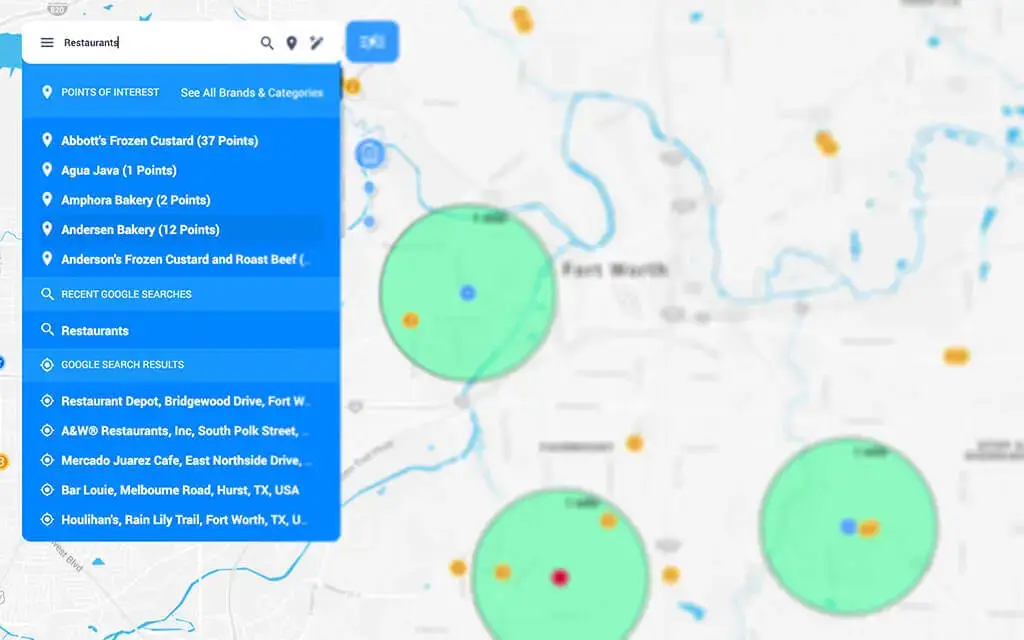

Points of interest database
What are points of interest?
CAP's current and accurate location data provides the context you need to closely analyze markets and strategically select sites. It is current, accurate, and GIS system-ready to help you make strategic location-based decisions.

Dynamic points of interest
What are google points-of-interest details?
Data refreshed in real time allows you to generate custom points of interest and layer generic ones.
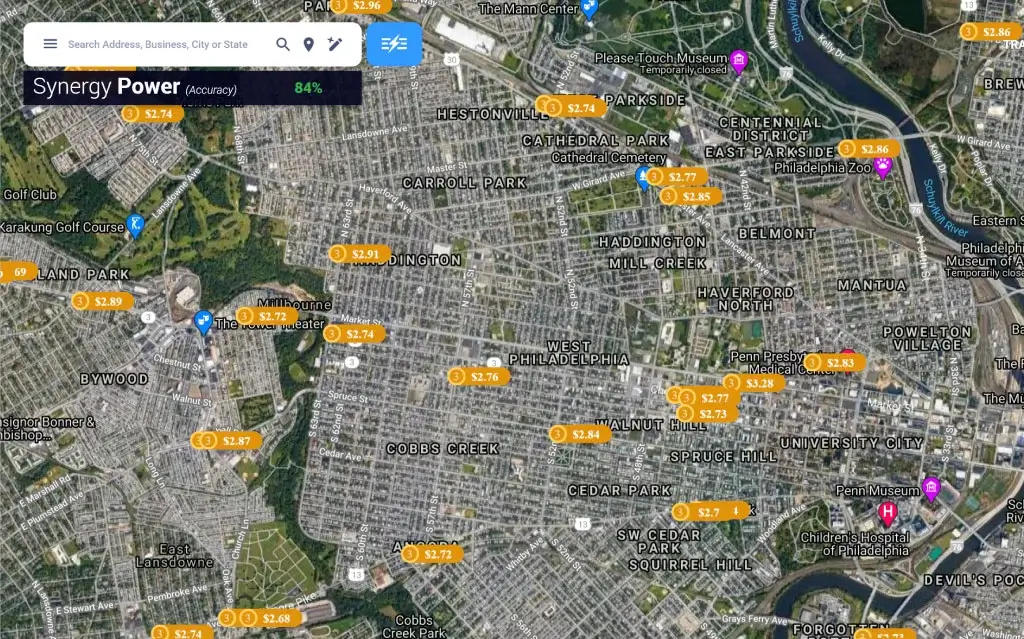

Estimated fuel pricing
What is Opis data
Oil Price Information Service (OPIS) is the most widely accepted pricing index for wholesale gas and diesel. By offering competitive fuel prices, convenience stores can increase their in-store foot traffic and substantially expand their profit margins.
Ready to see SiteZeus live?
Let's get started